
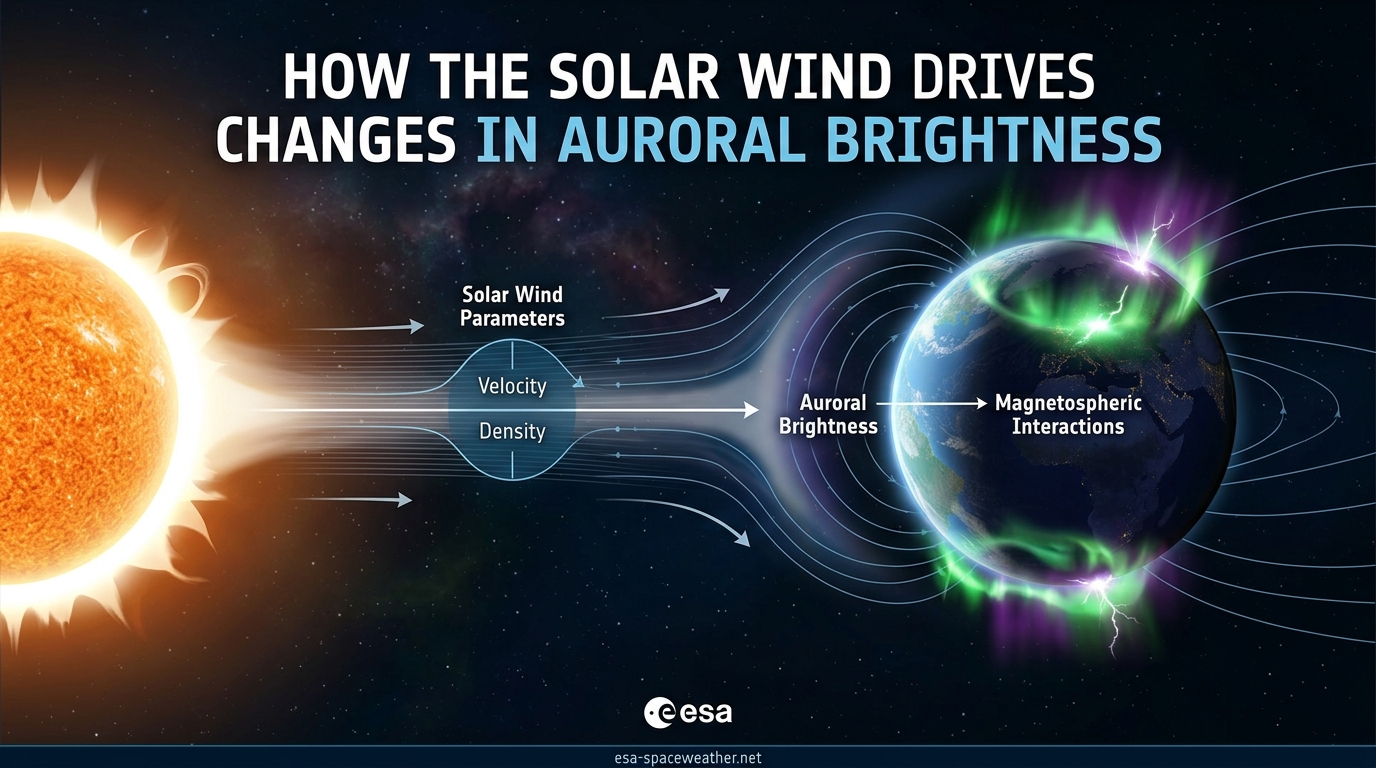
The solar wind drives changes in auroral brightness by carrying the Sun’s magnetic field into Earth’s magnetosphere, where magnetic reconnection transfers energy to trapped electrons that then plunge into the polar atmosphere and excite atoms of oxygen and nitrogen into emitting light. When solar wind speed increases and its embedded magnetic field turns southward, that energy transfer intensifies, producing brighter, more dynamic auroral displays.
If you have ever stood under a glowing aurora borealis and wondered why it pulses, shifts, and sometimes explodes into brilliant color overhead, the answer traces back to a stream of particles flowing from the Sun at hundreds of kilometers per second. Understanding how the solar wind drives changes in auroral brightness connects some of the most beautiful natural phenomena on Earth to their origins 150 million kilometers away.
Our team has spent years tracking real-time solar wind data from satellites at the L1 Lagrange point, watching how shifts in speed, density, and magnetic field orientation translate into the dancing lights visible from high-latitude skies. In this guide, we break down the full mechanism, from the Sun’s corona to the colors you see in the night sky, and we cover the specific solar wind parameters that aurora chasers monitor to predict when the lights will shine their brightest.
Table of Contents
What Is the Solar Wind?
The solar wind is a continuous outflow of charged particles, primarily electrons and protons, streaming outward from the Sun’s upper atmosphere, known as the corona. This plasma travels at speeds ranging from roughly 300 to 800 kilometers per second, carrying with it the interplanetary magnetic field (IMF), which is the Sun’s magnetic field extended outward through the solar system.
Despite the name, the solar wind is not wind in the everyday sense. There is no air involved. It is a flow of ionized gas, or plasma, moving through the near-vacuum of interplanetary space. The solar wind originates from regions of the Sun where magnetic field lines are open, allowing hot plasma to escape the Sun’s gravity and stream freely into the solar system.
Three key properties of the solar wind determine its impact on Earth and on auroral brightness:
- Speed: Slow solar wind travels at 300-500 km/s, while fast streams from coronal holes can exceed 700 km/s. Higher speed means greater kinetic energy delivered to the magnetosphere.
- Density: Typically 3-10 particles per cubic centimeter, but this varies significantly. Higher density means more particles interacting with the magnetopause, increasing dynamic pressure.
- Magnetic field orientation: The IMF’s vertical component, called Bz, is the single most important factor. When Bz points southward (negative), auroral activity increases dramatically.
These properties are not constant. They shift based on solar activity, the source region on the Sun, and whether a coronal mass ejection (CME) has recently erupted. Each change ripples through the solar system and eventually reaches Earth, where our magnetic field determines the outcome.
What Causes Auroral Brightness in the First Place?
Auroral brightness comes from atoms and molecules in Earth’s upper atmosphere releasing photons of light after being struck by energized electrons. When an electron traveling at high speed collides with an oxygen or nitrogen atom in the ionosphere at altitudes between 90 and 300 kilometers, it transfers energy to that atom. The atom briefly enters an excited state and then releases that excess energy as a photon of visible light.
Millions of these collisions happening simultaneously create what we perceive as the aurora. The brightness of the aurora depends directly on how many electrons are precipitating into the atmosphere and how much energy each one carries. More electrons and higher energies produce brighter auroras.
Here is a common misconception worth correcting: the electrons that create auroras do not come directly from the solar wind. The solar wind itself is deflected around Earth’s magnetosphere for the most part. Instead, the electrons responsible for auroral light already exist within Earth’s magnetosphere, trapped on magnetic field lines. The solar wind’s role is to provide the energy that accelerates these trapped electrons and drives them into the atmosphere. This distinction matters because it explains why auroras form at the poles, where Earth’s magnetic field lines converge and connect downward into the atmosphere, rather than everywhere the solar wind touches Earth.
How the Solar Wind Drives Changes in Auroral Brightness
The mechanism by which the solar wind drives changes in auroral brightness involves a chain of energy transfers that begins at the boundary of Earth’s magnetic shield and ends in the upper atmosphere. Earth’s magnetosphere acts as a barrier, deflecting most of the solar wind around the planet. A shock wave called the bow shock forms upstream, where the supersonic solar wind slows to subsonic speeds as it encounters the magnetopause, the outer boundary of the magnetosphere.
Under normal conditions, with a northward-oriented IMF, the solar wind slides past Earth with relatively little interaction. The magnetosphere remains closed and stable, and auroral brightness stays low, producing quiet, faint arcs along the auroral oval. But when conditions change, the entire system responds.
Energy enters the magnetosphere primarily through a process called magnetic reconnection. This occurs when the IMF points southward, opposite to Earth’s own magnetic field at the magnetopause. Opposite magnetic field lines merge and reconnect, effectively opening Earth’s protective shield and allowing solar wind energy, momentum, and plasma to flow into the magnetospheric system.
Once energy enters, it does not immediately create auroras. Instead, it gets stored in the magnetotail, the long extension of the magnetosphere on the night side of Earth that stretches away from the Sun. This stored energy builds up over a period of 30 minutes to several hours, creating what space physicists call a growth phase. During this phase, auroral brightness may actually decrease slightly as energy accumulates rather than dissipates.
When the stored energy reaches a critical threshold, the magnetotail undergoes a second reconnection event on the nightside. This releases the stored energy in a sudden burst, accelerating electrons downward along magnetic field lines toward the polar atmosphere. This event is called a substorm, and it is the primary mechanism behind the dramatic brightening, rapid movement, and explosive color changes that aurora watchers prize.
During a substorm, auroral brightness can increase by a factor of 10 or more within minutes. The aurora expands, brightens, and begins to move rapidly across the sky. This is the visual signature of millions of previously trapped electrons suddenly being energized and dumped into the ionosphere at energies of 1 to 10 kilo-electron volts.
The Dungey Cycle and Magnetic Reconnection
The full process of energy entering and circulating through the magnetosphere is known as the Dungey cycle, named after British physicist Jim Dungey who first described it in 1961. The cycle has three stages that operate continuously but vary in intensity based on solar wind conditions.
In the first stage, dayside reconnection, southward IMF field lines merge with Earth’s northward field lines at the magnetopause. This opens previously closed magnetic field lines, allowing them to be dragged downstream by the solar wind into the magnetotail. The rate of this opening depends directly on how strongly southward the IMF points.
In the second stage, the opened field lines stretch through the magnetotail, accumulating magnetic tension and stored energy. Plasma flows along these open field lines in a process called convection, mapping back toward Earth on the nightside.
In the third stage, nightside reconnection, the stretched field lines in the magnetotail pinch together and reconnect. This closes the field lines, returning them to their original dipole configuration, and releases a burst of energy that powers the substorm and drives electrons into the auroral zones. The Dungey cycle then begins again, with the rate of the entire cycle set by solar wind conditions.
When the solar wind is quiet and the IMF points northward, the Dungey cycle slows to a crawl. Reconnection rates drop, less energy enters the system, and auroral brightness remains low. When conditions turn favorable with high speed and southward Bz, the cycle accelerates, energy pours in, and auroras brighten dramatically.
Solar Wind Parameters That Control Auroral Brightness
Three primary solar wind parameters determine how bright an aurora will become. Aurora chasers and space weather forecasters monitor these values in real time using data from the ACE and DSCOVR satellites positioned at the L1 Lagrange point, approximately 1.5 million kilometers upstream of Earth toward the Sun.
The top three parameters that drive auroral brightness changes are:
- Solar wind speed: The kinetic energy of the solar wind scales with the square of its velocity, so doubling the speed quadruples the energy delivered. Speeds above 500 km/s are considered favorable for aurora, while speeds above 700 km/s from coronal hole high-speed streams can produce spectacular displays lasting several days.
- IMF Bz (north-south orientation): When Bz turns negative (southward), magnetic reconnection accelerates and energy floods into the magnetosphere. Bz values below -5 nT generally indicate enhanced auroral activity, and values below -10 nT are associated with major geomagnetic storms.
- Solar wind dynamic pressure: Calculated from density and speed, dynamic pressure determines how hard the solar wind pushes against the magnetopause. Sudden increases in dynamic pressure compress the magnetosphere, which can trigger immediate brightening of the dayside aurora even before substorm onset.
Solar wind density also plays a role, though more indirectly. Higher density combined with high speed increases dynamic pressure, which compresses the magnetosphere and can enhance reconnection rates. Typical solar wind density values range from 3 to 10 particles per cubic centimeter, but dense CME-driven solar wind can exceed 30 particles per cubic centimeter.
Southward IMF: The Single Most Important Condition
If you could monitor only one solar wind parameter to predict auroral brightness, it should be Bz. The north-south orientation of the interplanetary magnetic field is the dominant control on whether energy enters Earth’s magnetosphere and whether auroras will brighten.
Here is why: Earth’s magnetic field at the magnetopause points northward. When the IMF also points northward, the two fields are aligned, and little reconnection occurs. The magnetosphere stays closed and protected. But when the IMF flips to southward, the opposing field lines merge at the magnetopause, opening the shield and allowing solar wind energy to pour in.
The relationship is remarkably direct. Studies have shown that the auroral electrojet index, which measures ionospheric currents driven by auroral electron precipitation, correlates strongly with the clock angle of the IMF. A clock angle of 180 degrees, meaning purely southward Bz, produces the maximum reconnection rate and the brightest auroras.
Bz can shift rapidly, sometimes swinging from +10 nT to -15 nT within minutes. These rapid shifts are one reason aurora forecasts carry uncertainty. The ACE and DSCOVR spacecraft at L1 provide roughly 15 to 45 minutes of lead time before a Bz change reaches Earth, which is why experienced aurora chasers keep real-time data feeds open during active periods.
A practical tip from the aurora chasing community: watch for sustained southward Bz lasting more than 30 minutes. Brief Bz dips may not deposit enough energy to trigger a major substorm, but sustained southward orientation allows the growth phase to mature fully, increasing the likelihood of a dramatic brightness event.
Dayside vs Nightside Auroral Response
The aurora does not respond to solar wind changes uniformly across the globe. Dayside and nightside aurora behave differently because the underlying physics differs on each side of the planet. Understanding this distinction is key to interpreting why auroras brighten at different times and in different ways.
Dayside aurora responds almost immediately to solar wind changes, particularly to dynamic pressure pulses. When a sudden increase in solar wind density or speed compresses the magnetosphere, the dayside aurora brightens within seconds. This compression pushes the magnetopause inward, enhancing reconnection at the dayside magnetopause and driving electrons into the cusp region, a funnel-shaped area of magnetic field lines near magnetic noon.
Dayside aurora tends to be weaker and more structured, often appearing as faint red arcs or short-lived rays at high latitudes near local noon. These displays are visible during daylight hours only to specialized instruments, though they can sometimes be photographed at the edge of the polar cap during winter months.
Nightside aurora is where the dramatic action happens. This is the aurora most people see and photograph, and it is driven by the substorm process described earlier. The nightside aurora responds to solar wind changes with a delay of 30 minutes to several hours, because the energy must first travel through the magnetotail, accumulate, and then be released through nightside reconnection.
The nightside response is far more intense and visually spectacular. When a substorm breaks, the nightside aurora can explode from a faint green arc into a towering, multi-colored display spanning the entire sky. This difference in response time and intensity between the dayside and nightside is one of the most fascinating aspects of solar wind-aurora coupling, and it explains why the most impressive auroral displays occur in the hours around magnetic midnight.
CME vs Coronal Hole Auroras: Different Brightness Patterns
Not all bright auroras are created equal. Two distinct types of solar events drive most major auroral displays, and each produces characteristic brightness patterns, durations, and visual signatures. Knowing the difference helps aurora watchers set realistic expectations for upcoming events.
Coronal mass ejection (CME) auroras are the headline-grabbers. A CME is a massive eruption of plasma and magnetic field from the Sun that travels through space at speeds of 500 to 3,000 km/s. When a CME arrives at Earth, typically 1 to 3 days after eruption, it hits the magnetosphere like a freight train. The sudden shock compresses the magnetosphere violently, and if the CME’s embedded magnetic field points southward, intense reconnection follows.
CME-driven auroras are characterized by sudden, intense brightening that can push the auroral oval far equatorward, making auroras visible from mid-latitudes where they are rarely seen. The May 2024 geomagnetic storm, driven by a series of powerful CMEs, produced auroras visible as far south as Mexico and the Caribbean. These events are relatively short-lived at peak intensity, usually lasting 6 to 12 hours, but can be extraordinarily bright during that window.
Coronal hole high-speed stream (CH HSS) auroras are the steady workhorses of auroral activity. Coronal holes are regions on the Sun where the magnetic field opens outward, allowing fast solar wind to escape. When Earth passes through one of these streams, solar wind speed jumps from the typical 400 km/s to 600-800 km/s over the course of several hours.
Unlike the violent impact of a CME, coronal hole streams arrive gradually. They produce sustained auroral activity lasting 2 to 4 days, with moderate to high brightness levels. The aurora from a coronal hole stream tends to be more structured, with well-defined arcs and bands that undergo periodic substorm brightenings rather than one massive explosion. These events are highly predictable, as coronal holes can persist for multiple solar rotations, producing recurrent auroral activity every 27 days.
The key difference in brightness patterns: CME auroras hit hard and fast with extreme but brief brightness peaks, while coronal hole auroras deliver sustained, moderate brightness over many nights. Aurora chasers who understand both patterns can plan expeditions around either type of event.
The Kp Index and Auroral Brightness
The Kp index is the most widely used metric for communicating geomagnetic activity to the public. Developed by the German geophysicist Julius Bartels in 1949, Kp ranges from 0 (very quiet) to 9 (extreme storm), with each whole number representing a significant step in activity level.
Kp correlates directly with auroral brightness and the equatorward expansion of the auroral oval. At Kp 3, the aurora is visible from typical auroral zone latitudes (roughly 65-70 degrees magnetic latitude) with moderate brightness. At Kp 5, which marks the threshold of a minor geomagnetic storm, the auroral oval expands and brightens enough to be visible from mid-latitudes around 55-60 degrees magnetic latitude.
Kp 7 and above indicates major to severe storm conditions, with the aurora visible from locations far south of its usual range. During the May 2024 storm that reached Kp 9, the aurora was visible from every inhabited continent simultaneously.
It is worth noting that Kp is a 3-hour averaged index, which means it smooths over short-term brightness spikes. A substorm can produce a brief but intense auroral display even when Kp reads only 3 or 4. For real-time brightness prediction, aurora chasers rely on shorter-timescale metrics like the AE (auroral electrojet) index and direct solar wind measurements, which respond to changes within minutes rather than hours.
The 11-Year Solar Cycle and Aurora Frequency
Solar activity follows an approximately 11-year cycle, oscillating between solar minimum and solar maximum. This cycle profoundly affects the frequency and intensity of aurora-producing events, though the relationship is more nuanced than simply more solar activity equals more auroras.
During solar maximum, the Sun produces more sunspots, more solar flares, and more CMEs. This translates to more frequent opportunities for intense, CME-driven auroral storms. Solar maximum periods see the most dramatic, widely visible auroral events, though these tend to be sporadic and short-lived. The Sun entered solar maximum conditions in 2026 as part of Solar Cycle 25, which has been notably more active than its predecessor, Solar Cycle 24.
During the declining phase of the solar cycle, which typically lasts 3-4 years after solar maximum, coronal holes become more prominent and stable. This period produces the most consistent auroral activity of the entire cycle, with recurrent coronal hole high-speed streams arriving every 27 days. Aurora watchers during this phase can plan multi-day viewing expeditions around predictable windows of moderate to high activity.
During solar minimum, CMEs become rare and coronal holes weaken. Aurora frequency drops, and the auroral oval contracts poleward. However, auroras never stop entirely. Even at solar minimum, the solar wind continues to flow, the Dungey cycle continues to operate, and the aurora continues to shine, just more quietly and less frequently.
The current solar cycle, Cycle 25, has surprised researchers with its intensity. Forecasts initially predicted a weak cycle similar to Cycle 24, but solar activity through 2026 has significantly exceeded expectations, producing some of the strongest geomagnetic storms in decades.
Aurora Colors: What Atmospheric Chemistry Tells Us About Brightness
The colors of the aurora tell a story about which atoms are being excited and at what altitude. Because different atoms emit light at different wavelengths and dominate at different atmospheric depths, auroral color is directly linked to the energy of the precipitating electrons and the resulting brightness profile.
The main auroral colors and their origins:
- Green (557.7 nm): The most common auroral color, produced by atomic oxygen at altitudes of 90-150 km. Green indicates moderate electron energies of 1-3 keV. When the aurora is green and bright, electrons are depositing their energy efficiently in the dense lower ionosphere.
- Red (630.0 nm and 636.4 nm): Produced by atomic oxygen at higher altitudes of 200-400 km. Red aurora indicates lower-energy electrons that cannot penetrate deeply. A red lower border combined with green above signals a transition between energy regimes during intense substorms.
- Purple, pink, and blue: Produced by molecular nitrogen at altitudes below 90 km. These colors appear only during very energetic substorms when electrons carry enough energy to penetrate deeply into the atmosphere. Purple and pink auroral colors are a sign of high brightness and intense geomagnetic activity.
Bright auroras that span multiple color bands, such as green with a red upper border and a purple lower edge, indicate that electrons across a wide energy range are simultaneously precipitating. This is a hallmark of peak substorm activity and represents the maximum auroral brightness achievable during a given event.
The color-altitude relationship also explains why very bright auroras appear to have structure and depth. During intense events, different atmospheric layers glow simultaneously at different wavelengths, creating a three-dimensional curtain of light that can shift color in real time as electron energies fluctuate.
Why Aurora Forecasts Sometimes Fail
Anyone who has chased auroras has experienced the frustration of a forecasted storm that produced nothing visible. Understanding why forecasts fail requires acknowledging both the complexity of the solar wind-magnetosphere system and the limitations of current prediction methods.
The primary reason forecasts miss is Bz unpredictability. While satellites at L1 can measure solar wind speed, density, and Bz in real time, they cannot predict what Bz will do more than about an hour in advance. A CME may arrive with strongly southward Bz as predicted by models, but Bz can rotate northward before the energy fully couples into the magnetosphere, effectively shutting off the auroral engine.
The timing problem compounds this. L1 data provides only 15 to 45 minutes of lead time, depending on solar wind speed. For slower solar wind, the delay is longer, but the connection between L1 measurements and magnetospheric response is also less direct. The magnetosphere is a complex, dynamic system that does not always respond predictably to a given set of solar wind inputs.
Local factors also matter. Cloud cover is the most common reason an aurora goes unseen despite being present overhead. Light pollution from cities, terrain blocking the northern horizon, and the observer’s magnetic latitude relative to the auroral oval all determine whether an aurora will be visible even when it is active.
Finally, substorm timing is inherently difficult to predict. Energy may accumulate in the magnetotail for hours, and the exact moment of release depends on internal magnetospheric conditions that are not fully measurable from outside. A forecast can correctly predict that conditions are favorable, but the actual substorm may trigger hours earlier or later than expected.
How to Read Real-Time Solar Wind Data for Aurora Prediction
With the right tools and knowledge, anyone can monitor solar wind conditions and make informed predictions about upcoming auroral activity. The aurora chasing community on forums like Reddit’s r/SolarMax and SpaceWeatherLive has developed practical protocols for interpreting real-time data that rival professional forecasting methods.
Here is a step-by-step approach to reading solar wind data:
Step 1: Check Bz first. Open a real-time solar wind dashboard (SpaceWeatherLive, NOAA SWPC, or the SWPC’s ACE data page). If Bz is negative and has been southward for more than 30 minutes, conditions are favorable. If Bz is positive (northward), the aurora will likely remain quiet regardless of other parameters.
Step 2: Evaluate solar wind speed. Look for speeds above 500 km/s. Speeds above 600 km/s indicate a high-speed stream or CME influence and significantly increase the likelihood of bright auroras when combined with southward Bz.
Step 3: Check density. Solar wind density above 10 protons per cubic centimeter suggests a dense plasma source, often associated with CME sheath regions. Combined with high speed and southward Bz, this is the recipe for a major geomagnetic storm.
Step 4: Monitor the Kp index trend. Watch whether Kp is climbing or falling over the previous 3-hour periods. A rising Kp trend during favorable solar wind conditions suggests the magnetosphere is responding actively and auroral brightness is increasing.
Step 5: Watch for substorm signs. Real-time magnetometer data from stations near your latitude can reveal substorm onset. A sudden sharp deflection in the horizontal magnetic field component indicates a substorm has begun, and bright aurora should follow within minutes.
The most important thresholds to remember for favorable aurora viewing:
- Bz below -5 nT and sustained for 30+ minutes
- Solar wind speed above 500 km/s (above 700 km/s for exceptional displays)
- Density above 10 protons per cubic centimeter (indicates CME influence)
- Kp at 5 or above for mid-latitude visibility
Experienced aurora chasers keep these data feeds running on their phones and computers during active periods, refreshing every few minutes. The 15 to 45 minute lead time from L1 measurements is enough to grab camera gear and drive to a dark sky location when conditions turn favorable.
FAQs
What is a good solar wind speed for northern lights visibility?
A solar wind speed of 500 km/s or higher is generally favorable for aurora viewing. Speeds above 600 km/s from coronal hole high-speed streams can produce sustained displays lasting several days, while CME-driven speeds above 800 km/s can trigger intense geomagnetic storms with bright auroras visible at mid-latitudes. However, speed alone is not sufficient. The IMF Bz must also point southward for significant auroral brightness to develop.
Why does southward Bz make auroras brighter?
Southward Bz means the interplanetary magnetic field points opposite to Earth’s magnetic field at the magnetopause. This orientation enables magnetic reconnection, where opposing field lines merge and open Earth’s protective magnetic shield. Solar wind energy then flows into the magnetosphere, gets stored in the magnetotail, and is released during substorms as bursts of energized electrons that drive into the polar atmosphere, producing much brighter auroras. Northward Bz suppresses this process, keeping auroras dim.
How long after a solar wind change does the aurora respond?
Dayside aurora responds almost instantly to solar wind pressure changes, brightening within seconds. Nightside aurora, which is what most observers see, responds with a delay of 30 minutes to several hours because energy must first travel through the magnetotail and accumulate before being released in a substorm. The ACE and DSCOVR satellites at the L1 point provide roughly 15 to 45 minutes of advance warning before a solar wind change reaches Earth.
Can solar wind directly harm humans on Earth?
No, the solar wind cannot directly harm humans on Earth’s surface. Earth’s atmosphere and magnetic field provide complete protection from solar wind particles. The solar wind is fully deflected or absorbed before reaching the surface. However, the geomagnetic storms driven by solar wind activity can disrupt satellites, GPS systems, radio communications, and in extreme cases, power grids. Astronauts in space and high-altitude pilots can face increased radiation exposure during major solar events.
What solar wind conditions produce the brightest auroras?
The brightest auroras occur when three conditions align simultaneously: solar wind speed exceeds 700 km/s, the IMF Bz points strongly southward (below -10 nT) for an extended period, and solar wind density is elevated above 10 particles per cubic centimeter. This combination typically occurs during the arrival of a powerful coronal mass ejection with a sustained southward magnetic field. These conditions drive intense magnetic reconnection, flood the magnetosphere with energy, and trigger major substorms that produce spectacular, multi-colored auroral displays visible far beyond the normal auroral zone.
Why do auroras only appear near the poles?
Auroras appear near the poles because Earth’s magnetic field lines converge there, creating funnel-shaped regions that guide charged electrons down into the upper atmosphere. The auroral oval, a ring-shaped zone centered on each magnetic pole, marks where these field lines reach the ionosphere. Electrons accelerated along converging field lines from the magnetotail deposit their energy in this narrow zone, exciting oxygen and nitrogen atoms to emit light. At lower latitudes, the magnetic field lines do not connect to the magnetotail, so electrons cannot reach the atmosphere there except during extreme geomagnetic storms that expand the auroral oval equatorward.
Conclusion
The solar wind drives changes in auroral brightness through a remarkable chain of events that connects the Sun’s corona to the upper atmosphere above Earth’s poles. Speed, density, and magnetic field orientation each play distinct roles, but southward Bz is the master switch that determines whether energy enters the magnetosphere and whether auroras will blaze or remain quiet.
Whether triggered by a violent CME impact or a sustained coronal hole high-speed stream, the underlying mechanism remains the same: magnetic reconnection opens Earth’s shield, energy floods in, and electrons trapped in the magnetosphere get accelerated into the ionosphere where they excite atoms into glowing. Solar Cycle 25 in 2026 continues to produce exceptional opportunities to witness this process firsthand.
For those who want to experience these events, the tools and data are freely available. Monitor Bz, watch solar wind speed, track Kp trends, and keep your camera ready. The next great auroral display could be only 30 minutes away, and now you understand exactly why.