
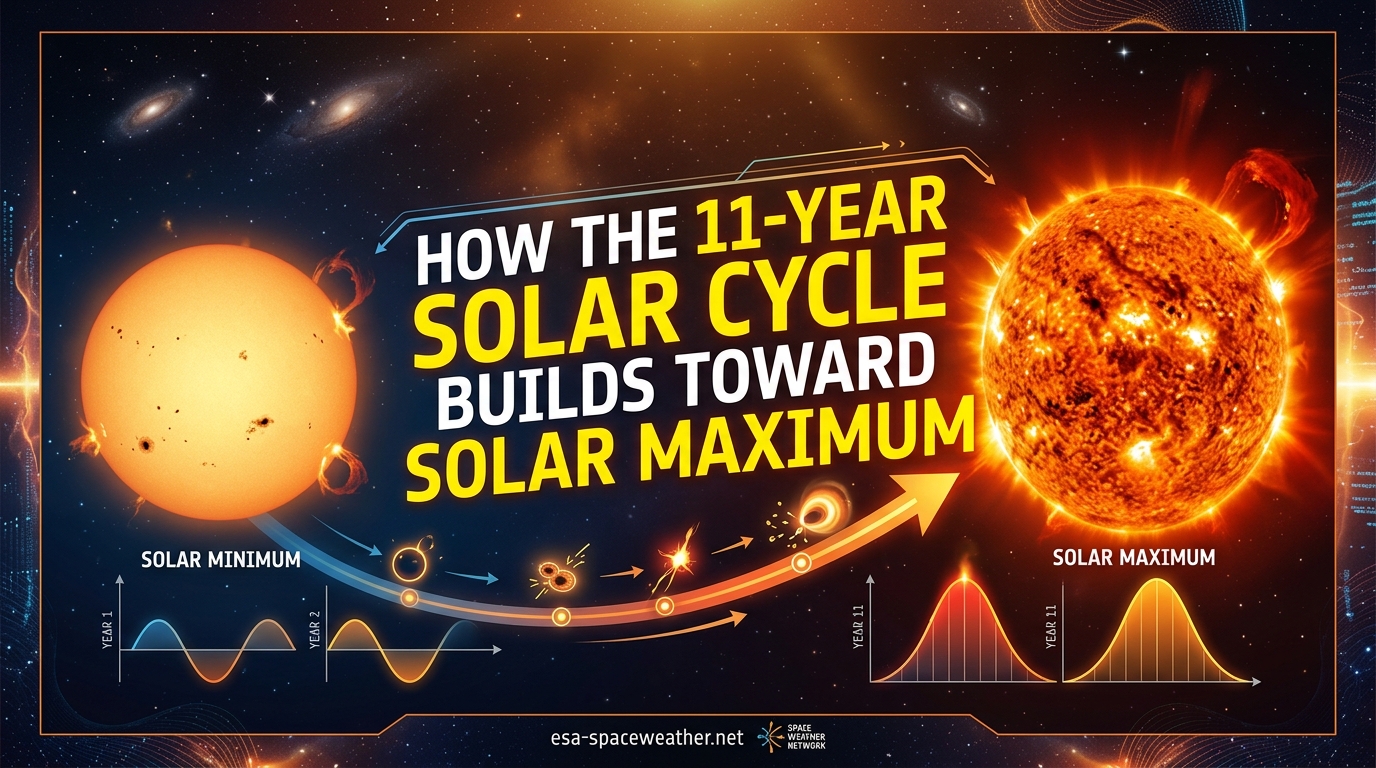
The Sun is not a steady, unchanging light in the sky. It breathes, pulses, and cycles through periods of violent activity and eerie calm on a rhythm that scientists have tracked for over two centuries. This rhythm is the 11-year solar cycle, and understanding how it builds toward its explosive peak, known as solar maximum, is one of the most important challenges in modern heliophysics.
Right now, in 2026, we are living through the peak of Solar Cycle 25. The Sun has been firing off X-class flares, hurling coronal mass ejections toward Earth, and painting skies with auroras as far south as Mexico and Italy. If you have seen the northern lights from your backyard recently, you have witnessed the solar cycle at its most dramatic.
The 11-year solar cycle is the Sun’s natural pattern of magnetic activity, during which sunspot numbers, solar flares, and coronal mass ejections gradually build from near-zero at solar minimum to a peak at solar maximum, before declining back over roughly 11 years. This progression is driven by the solar dynamo, a churning engine of electrically charged plasma deep inside the Sun that slowly twists and reorganizes the magnetic field until the poles flip.
In this guide, I will walk you through exactly how the 11-year solar cycle builds toward solar maximum, step by step. We will cover the physics of the solar dynamo, the role of sunspots as tracking signposts, the year-by-year progression from minimum to peak, the effects on Earth, and where Solar Cycle 25 stands right now. Whether you are an aurora chaser, an amateur radio operator, or simply curious about how our star works, this article will give you a clear picture of the solar cycle’s dramatic arc.
Table of Contents
What Is the 11-Year Solar Cycle?
The 11-year solar cycle is the periodic change in the Sun’s activity levels, driven by the continuous reorganization of its magnetic field. Every 11 years or so, the Sun transitions from a quiet, spotless state called solar minimum to a frenzied peak of magnetic chaos called solar maximum, then calms back down to start the cycle anew.
To understand this cycle, you need to know that the Sun is not a solid object. It is a giant ball of plasma, which means it is made of electrically charged gas that is so hot electrons have been stripped away from their atoms. This plasma is constantly moving, flowing, and churning. Because the plasma carries electric charge, its motion generates magnetic fields. Those magnetic fields are the engine of everything the solar cycle produces.
One common source of confusion, frequently raised in forums like r/space and r/askscience, is why the cycle is described as “about 11 years” rather than exactly 11 years. The reality is that solar cycle length varies significantly. Historical records show cycles as short as 9 years and as long as 14 years. The Sun does not have a precise clock ticking inside it. Instead, the cycle length depends on the complex, chaotic behavior of plasma flows deep within the solar interior, which makes each cycle slightly different.
Scientists have been numbering solar cycles since 1755, when regular sunspot observation began. Solar Cycle 1 was the first cycle tracked with systematic telescopic records. We are now in Solar Cycle 25, which began in December 2019. That means humanity has now observed 25 complete cycles of solar activity, giving researchers a deep dataset to study how the Sun’s magnetic heartbeat works.
Each cycle is marked by a complete reversal of the Sun’s magnetic poles. At the start of a cycle, the Sun’s north magnetic pole is in one orientation. By the time the cycle reaches solar maximum, that pole has flipped to the opposite orientation. When it flips back in the following cycle, the Sun has completed what physicists call a full magnetic oscillation, which takes roughly 22 years. This brings us to one of the most fascinating aspects of solar physics: the Babcock-Leighton dynamo.
The Solar Dynamo: The Engine Behind the Cycle
The solar dynamo is the physical process that generates and reorganizes the Sun’s magnetic field, and it is the fundamental mechanism driving the 11-year solar cycle. Without the dynamo, there would be no sunspots, no solar flares, no solar cycle at all. The Sun would be a featureless, quiet star.
Here is how it works. The Sun does not rotate like a solid ball. Because it is made of plasma, different parts rotate at different speeds. The equator completes a rotation in about 25 days, while the polar regions take about 35 days. This phenomenon is called differential rotation, and it is the key ingredient of the solar dynamo.
Imagine the Sun’s magnetic field as a set of simple north-south lines running from pole to pole beneath the surface. As the equator rotates faster than the poles, these magnetic field lines get stretched and wrapped around the Sun’s midsection. Over the course of several years, the field lines wind tighter and tighter, like a rubber band being twisted.
As the magnetic field lines become increasingly tangled and complex, they develop kinks and loops that poke through the Sun’s visible surface, called the photosphere. Where these magnetic loops break through, they block heat from rising to the surface, creating dark, cool regions we see as sunspots. The more tangled the field becomes, the more sunspots appear.
This tangling process is gradual. In the early years of a cycle, the field is still relatively organized, and sunspot numbers are low. But as the years pass and the field twists further, sunspot numbers climb steeply. This is the core of how the solar cycle builds toward maximum.
Eventually, the magnetic field becomes so chaotic and twisted that it undergoes a dramatic reorganization. The north and south magnetic poles swap places. This magnetic field reversal marks the period of solar maximum. After the flip, the field begins to simplify and relax, sunspot numbers decline, and the Sun enters its declining phase toward the next minimum.
The 22-Year Babcock-Leighton Cycle
Here is where things get even more interesting. A single 11-year cycle reverses the magnetic poles once. But the Sun’s magnetic field does not return to its original state after just one flip. It takes two 11-year cycles, totaling about 22 years, for the magnetic field to complete a full oscillation and return to its starting configuration.
This 22-year pattern is called the Babcock-Leighton cycle, named after the astronomers Horace Babcock and Robert Leighton who developed the theory in the mid-20th century. In the first 11-year half-cycle, the magnetic poles flip from one orientation to the other. In the second 11-year half-cycle, they flip back. Only after both flips does the Sun’s magnetic field return to its original state.
Why does this matter? Because the Babcock-Leighton cycle helps explain why consecutive solar cycles can behave differently. The magnetic field entering cycle N is in a different state than the field entering cycle N+1. This contributes to the variation in cycle strength, length, and sunspot numbers that scientists observe from one cycle to the next. Most articles stop at the 11-year explanation, but understanding the 22-year magnetic cycle gives you a much deeper picture of why the Sun behaves the way it does.
The Babcock-Leighton model also helps explain a curious observation: sunspots in a new cycle appear at high solar latitudes, while sunspots from the old, dying cycle persist near the equator. As a cycle progresses, new sunspots appear at progressively lower latitudes. This pattern, first noticed by Richard Carrington in the 1850s and now known as Spoerer’s Law, is a direct consequence of how the magnetic field migrates equatorward during the dynamo process.
Tracking the Cycle: Sunspots as Signposts
Sunspots are the primary observable indicator of where the Sun stands in its 11-year cycle. These dark patches on the solar surface are regions of intense magnetic activity where the magnetic field is so strong it blocks heat from rising through convection. A typical sunspot is about 1,500 degrees Celsius cooler than the surrounding photosphere, which makes it appear dark by contrast.
Scientists use a metric called the sunspot number to track solar cycle progress. This is not simply a count of individual spots. The international sunspot number formula counts both individual spots and groups of spots, with groups weighted more heavily because they represent larger magnetic structures. A sunspot count of 150, for example, might represent 30 groups containing 5 spots each, or some other combination.
To smooth out daily fluctuations, scientists use the 13-month smoothed sunspot number. This is a running average that eliminates short-term spikes and dips, revealing the underlying trend. The smoothed number is what determines when solar minimum and solar maximum officially occur. A cycle is declared at maximum when the smoothed sunspot number reaches its peak, and at minimum when it bottoms out.
The authoritative source for sunspot data is the SILSO (Sunspot Index and Long-term Solar Observations) center at the Royal Observatory of Belgium. SILSO has maintained the international sunspot record since 1981, compiling observations from dozens of observatories worldwide. This data stretches back to the earliest telescopic observations by Galileo Galilei and Christoph Scheiner in the early 1600s, giving us over 400 years of solar cycle records.
If you want to track the solar cycle yourself, you do not need a PhD or a million-dollar observatory. Many amateur astronomers count sunspots with basic telescopes equipped with proper solar filters. The American Association of Variable Star Observers (AAVSO) runs a solar observing program that trains volunteers to count sunspots using a standardized methodology. There are also free apps and websites, including NOAA’s Space Weather Prediction Center, that publish daily sunspot numbers and solar imagery from instruments like the Solar Dynamics Observatory.
From Minimum to Maximum: The Buildup Phase
The most common question people ask about the solar cycle is: how exactly does the Sun build from its quiet minimum to its explosive maximum? No single competitor article traces this step-by-step progression, so let me walk you through it year by year.
The cycle begins at solar minimum, the period of lowest solar activity. During minimum, the Sun’s face can be spotless for weeks at a time. Sunspot numbers may drop to zero. Solar flares are rare and weak. Coronal mass ejections are infrequent. The Sun’s magnetic field is at its simplest and most organized, with clean north-south field lines running from pole to pole.
Year 1-2 after minimum (early rising phase): The first sunspots of the new cycle begin appearing at high solar latitudes, around 25 to 30 degrees north and south of the equator. These early spots are small and short-lived. Sunspot numbers remain low, typically in the range of 10-30 on the smoothed index. But their magnetic polarity is reversed from the old cycle’s spots, confirming a new cycle has begun. Scientists confirm a new cycle has started when they observe these polarity-reversed spots at high latitudes while old-cycle spots are still fading near the equator.
Year 2-3 (mid rising phase): Sunspot numbers begin a noticeable climb. Active regions, which are areas of strong magnetic activity that can produce flares, become more common. The smoothed sunspot number typically rises to 40-60. Solar flares become more frequent, though most are still relatively weak C-class or B-class events. The Sun’s magnetic field lines are becoming noticeably more twisted as differential rotation continues stretching them around the equator.
Year 3-4 (late rising phase): This is where the acceleration becomes dramatic. Sunspot numbers climb steeply, often reaching 80-120 on the smoothed index. Active regions grow larger and more complex. M-class flares become common, and the first X-class flares of the cycle may occur. Coronal mass ejections increase in frequency and strength. Auroras begin appearing at lower latitudes as more geomagnetic storms reach Earth. The magnetic field is now severely tangled, with complex loop structures breaking through the surface across a wide band of latitudes.
Year 4-5 (approaching maximum): The Sun is now in the final approach to maximum. Sunspot numbers peak or are near peaking, often exceeding 150 on the smoothed index. Multiple active regions can be visible simultaneously on the Sun’s Earth-facing side. X-class flares occur regularly. Coronal mass ejections happen multiple times per day. The Sun’s magnetic poles are in the process of flipping, which is the defining event of solar maximum.
The Double Peak Phenomenon
One thing that catches many people by surprise is that solar maximum often produces not one peak but two. This double peak occurs when the smoothed sunspot number rises to an initial peak, dips slightly, then rises again to a second peak. The two peaks are typically separated by 1 to 2 years.
The double peak was clearly visible in Solar Cycle 24 (peaks in 2012 and 2014) and appears in many other historical cycles. Scientists believe it reflects the complex nature of the solar dynamo, where magnetic activity at different latitudes can peak at slightly different times. The northern and southern hemispheres of the Sun do not always peak simultaneously, which can create the characteristic two-humped maximum.
This is one of the reasons why forum users on Reddit frequently express frustration that scientists cannot pinpoint the exact month of solar maximum in real time. The smoothed sunspot number requires 6 months of future data to calculate for any given month, which means maximum can only be confirmed retroactively. The Solar Cycle Prediction Panel typically waits until sunspot numbers have shown a consistent, undeniable decline before officially declaring that maximum has passed.
Why the Buildup Is Non-Linear
The solar cycle’s rise from minimum to maximum is not a smooth, straight line on a graph. The early years are slow and gradual, while the final 1-2 years before maximum see a sharp acceleration. This non-linear pattern is a direct consequence of the magnetic dynamo physics.
In the early rising phase, the magnetic field lines are only mildly twisted, and relatively few break through the surface. But as differential rotation continues winding the field tighter, the process becomes self-reinforcing. More magnetic loops break through, creating more active regions, which generate more complex magnetic structures, which produce more flares and eruptions. The system builds on itself, creating a snowball effect that accelerates toward maximum.
After maximum, the decline is typically slower and more gradual than the rise. The Sun takes roughly 5-7 years to wind down from maximum to the next minimum, compared to about 4-5 years to ramp up. This asymmetry between the rising and declining phases is another characteristic feature of the solar cycle that helps scientists identify where we are in the current cycle.
What Happens at Solar Maximum?
Solar maximum is the period of peak solar activity within the 11-year cycle, marked by the highest sunspot numbers, the most frequent and intense solar flares, and the highest rate of coronal mass ejections. It is also the time when the Sun’s magnetic poles complete their reversal.
During maximum, the smoothed sunspot number typically reaches between 100 and 200, though this varies significantly from cycle to cycle. Strong cycles like Cycle 19 (peaking in 1958) have reached over 250, while weak cycles like Cycle 24 (peaking in 2014) barely exceeded 110. The Sun’s face during maximum can be covered with dozens of active regions simultaneously, some of them large enough to see without magnification (with proper solar filters, of course).
Solar Flares: The Sun’s Explosive Bursts
Solar flares are sudden, intense bursts of electromagnetic radiation released when magnetic energy stored in active regions is suddenly discharged through a process called magnetic reconnection. Scientists classify flares by their X-ray brightness using a lettered scale:
A-class flares are the weakest, near background levels. B-class flares are minor, with minimal Earth impact. C-class flares are small with few noticeable consequences. M-class flares are medium-sized and can cause brief radio blackouts in polar regions. X-class flares are the most powerful, capable of triggering planet-wide radio blackouts, radiation storms, and geomagnetic disruptions.
Each letter class is on a logarithmic scale, meaning each step is 10 times more powerful than the previous. An X-class flare is 10 times stronger than an M-class, which is 10 times stronger than a C-class. Within each class, a number provides finer detail. An X9 flare is nine times more powerful than an X1 flare.
During solar maximum, X-class flares can occur multiple times per month. The most powerful flare of Solar Cycle 25 so far was an X9.0 on October 3, 2024, which caused widespread high-frequency radio blackouts. For comparison, the famous 2003 Halloween storms produced an X28 flare (some analyses estimate X45), and the 1989 flare that triggered the Quebec power outage was approximately X15.
Coronal Mass Ejections: Plasma Bombs
Coronal mass ejections, or CMEs, are massive eruptions of plasma and magnetic field from the Sun’s corona, the outermost layer of the solar atmosphere. A single CME can eject billions of tons of material at speeds exceeding 2,000 kilometers per second. NOAA’s educational materials describe a CME as containing the energy of roughly one billion hydrogen bombs.
Not all solar flares produce CMEs, and not all CMEs are associated with flares. But the most impactful space weather events typically involve both: a powerful flare launches simultaneously with a fast CME directed at Earth. When a CME arrives at our planet 1 to 3 days later, it can compress Earth’s magnetic field and trigger a geomagnetic storm.
During solar maximum, the Sun produces CMEs at a rate of several per day. During solar minimum, that rate drops to less than one per week. This 10-fold increase in CME frequency is one of the most dramatic differences between minimum and maximum.
Solar Energetic Particles
Solar energetic particles, or SEPs, are high-energy protons and electrons accelerated to near light speed during solar flares and CME-driven shocks. These particles can reach Earth in as little as 15 minutes after a flare, compared to the 1-3 day travel time for CMEs. SEPs pose a radiation hazard to astronauts, particularly those on future lunar or Mars missions where Earth’s magnetic field does not provide protection. They can also damage satellite electronics and interfere with high-frequency radio communications near the poles.
Solar Minimum vs. Solar Maximum: A Quick Comparison
To make the differences crystal clear, here is a side-by-side comparison of what the Sun looks like during solar minimum versus solar maximum. No competitor article provides this structured comparison, but it is one of the most useful ways to understand the cycle’s extremes.
Smoothed sunspot number: Solar minimum sees 0-15 sunspots. Solar maximum sees 100-250+ sunspots.
X-class flare frequency: Solar minimum may go months or years without one. Solar maximum produces multiple X-class flares per month.
CME rate: Solar minimum averages less than one CME per day. Solar maximum sees several CMEs per day.
Aurora visibility: Solar minimum limits auroras to high latitudes (above 60 degrees). Solar maximum pushes auroras to mid-latitudes and sometimes even subtropical latitudes.
HF radio propagation: Solar minimum provides poor propagation on higher HF bands (20-10 meters). Solar maximum opens these bands for worldwide DX communication, though solar flares can cause sudden absorption blackouts.
Magnetic field orientation: Solar minimum has a simple, organized dipole field. Solar maximum has a tangled, chaotic field with poles in the process of flipping.
Solar wind speed: Solar minimum features faster but steadier solar wind streams. Solar maximum features more variable, turbulent solar wind driven by CMEs and active region outflows.
Solar Cycle 25: Where We Are Now
Solar Cycle 25 began in December 2019, when the Sun was at its minimum between Cycle 24 and Cycle 25. At that time, the Sun was remarkably quiet, with spotless days occurring frequently throughout 2019 and early 2020. The official prediction from the Solar Cycle Prediction Panel, made in 2019, forecast a peak smoothed sunspot number of 115, making Cycle 25 similar in strength to the relatively weak Cycle 24.
The actual progression has significantly exceeded those predictions. Sunspot numbers began climbing faster than expected in 2022, and by 2023 the smoothed number was already approaching the predicted peak. In October 2024, NASA, NOAA, and the international Solar Cycle Prediction Panel announced that the Sun had entered its solar maximum period. The strongest single month for sunspot activity occurred in August 2024, when over 300 individual sunspots were counted.
Space.com reported that the strongest peaks in sunspot numbers appeared in the summers of 2023 and 2024, with the current peak occurring around October 2024. This suggests Solar Cycle 25 may be exhibiting its own version of the double peak phenomenon, with a potential secondary surge still possible.
Notable Events of Solar Cycle 25
Several dramatic events have already marked Solar Cycle 25 as one of the more active cycles in recent decades. In May 2024, a series of powerful solar flares and CMEs produced the strongest geomagnetic storm to hit Earth in over two decades. The G5-class storm (the highest severity level on NOAA’s scale) triggered spectacular aurora displays visible as far south as Puerto Rico, Mexico, and southern Europe. Millions of people worldwide saw the northern lights for the first time in their lives.
Forum users on r/space reported watching auroras from locations that had not seen them in living memory. People in Texas, Florida, and Italy shared photos of deep red and green aurora displays. This event was a powerful demonstration of what solar maximum can produce and served as a real-time lesson in space weather for the general public.
In October 2024, the Sun unleashed an X9.0 solar flare, the most powerful flare of Solar Cycle 25. This flare caused widespread high-frequency radio blackouts across the sunlit side of Earth and was accompanied by a CME that produced additional geomagnetic activity. Later that same month, NASA’s Parker Solar Probe made its closest-ever approach to the Sun, flying through the corona at a distance of just 6.2 million kilometers from the solar surface, collecting unprecedented data on the solar wind and magnetic field during peak activity.
How Solar Cycle 25 Compares to Predictions
The Solar Cycle Prediction Panel’s 2019 forecast of a peak sunspot number of 115 has proven significantly conservative. The actual peak appears to be closer to 150-160 on the smoothed index, making Cycle 25 notably stronger than its predecessor, Cycle 24, which peaked at about 116. This underprediction highlights the ongoing challenge of solar cycle forecasting.
This is a recurring pattern in solar physics. Cycle 24 was also underpredicted initially, and the panel revised its forecast downward as the cycle progressed. The difficulty stems from the fact that the solar dynamo is a complex, nonlinear system. Small changes in the initial conditions of plasma flows deep inside the Sun can lead to significantly different outcomes in cycle strength and timing.
The solar maximum period of Cycle 25 is expected to continue through 2025 and potentially into early 2026. The exact end of maximum will only be confirmed when the smoothed sunspot number shows a consistent, sustained decline over several months. After maximum, the Sun will enter its declining phase, which typically lasts 5-7 years, before reaching the next solar minimum around 2030-2031.
Effects of Solar Maximum on Earth
The reason scientists, governments, and industry care so much about solar maximum is that it drives space weather, which can have significant effects on Earth’s technology and infrastructure. These effects range from beautiful and harmless to costly and dangerous.
Auroras: The Beautiful Side of Space Weather
The most visible and beloved effect of solar maximum is the aurora borealis (northern lights) and aurora australis (southern lights). Auroras occur when charged particles from the solar wind, funneled by Earth’s magnetic field toward the poles, collide with oxygen and nitrogen atoms in the upper atmosphere. These collisions release photons of light, creating the shimmering green, red, and purple curtains that dance across polar skies.
During solar maximum, stronger geomagnetic storms expand the auroral oval, pushing auroras to much lower latitudes. The May 2024 storm brought auroras to all 50 U.S. states, something that had not happened since the Halloween storms of 2003. For aurora chasers and photographers, solar maximum is the golden era, offering opportunities to capture these lights from locations that may not see them again for a decade.
Power Grid Disruption
On the dangerous side, geomagnetic storms can induce electrical currents in long conductors on Earth, particularly power transmission lines. These geomagnetically induced currents can overload transformers and cause widespread power outages. The most famous example is the March 1989 geomagnetic storm that collapsed the Hydro-Quebec power grid in just 90 seconds, leaving 6 million people without electricity for 9 hours.
During solar maximum, power grid operators worldwide implement special procedures to protect infrastructure during geomagnetic storms. They may reduce load on transformers, cancel maintenance, and increase staffing. The potential for a Carrington-level event (more on that below) to cause widespread, long-duration power outages is one of the most serious space weather concerns for governments and the insurance industry.
Satellite Damage and Orbital Drag
Satellites are particularly vulnerable during solar maximum. Increased solar radiation heats and expands Earth’s upper atmosphere, increasing drag on low-Earth-orbit satellites. This drag can cause satellites to lose altitude prematurely, and in extreme cases, can cause them to burn up in the atmosphere entirely. In February 2022, SpaceX lost 40 newly launched Starlink satellites when a geomagnetic storm increased atmospheric drag just after deployment.
Solar flares and energetic particles can also damage satellite electronics, causing single-event upsets, solar panel degradation, and in some cases total satellite failure. Satellite operators must design their spacecraft to withstand the radiation environment of solar maximum, which is significantly harsher than during minimum.
GPS and Communication Interference
Earth’s ionosphere, the ionized layer of the upper atmosphere, is strongly affected by solar activity. Solar flares can cause sudden ionospheric disturbances that disrupt high-frequency radio communications, particularly on the sunlit side of Earth. Within minutes of a strong X-class flare, pilots, mariners, and military communicators may lose HF radio contact.
GPS signals pass through the ionosphere, and variations in ionospheric density during geomagnetic storms can introduce positioning errors. During solar maximum, these errors can increase from a few meters to tens of meters, affecting precision applications like surveying, agriculture, and autonomous navigation. NOAA’s Space Weather Prediction Center issues alerts to help GPS users compensate for these disturbances.
Astronaut and Aviation Radiation Safety
Solar energetic particle events pose a radiation hazard to humans in space and at high altitudes. Astronauts on the International Space Station, inside Earth’s magnetic shield, receive some protection, but they still monitor radiation levels closely and may retreat to better-shielded areas during major events. For future Artemis missions to the Moon, where astronauts will travel beyond Earth’s magnetic protection, solar particle events are a serious mission-planning concern.
Commercial aviation is also affected. Airlines reroute polar flights during solar radiation storms to reduce radiation exposure to crew and passengers. A typical transpolar flight during a major SEP event can deliver radiation doses equivalent to several chest X-rays. Solar maximum means more flight diversions, longer routes, and higher fuel costs for airlines operating polar routes.
Amateur Radio: A Double-Edged Sword
For amateur radio operators, solar maximum is a mixed blessing. The increased ionization of the upper atmosphere dramatically improves propagation on higher HF bands (20, 15, and 10 meters), opening up worldwide contacts that are impossible during solar minimum. Operators on r/amateurradio regularly report making contacts across continents on bands that have been dead for years.
However, solar flares can cause sudden, total absorption of HF signals on the sunlit side of Earth, a phenomenon known as a Dellinger fade. These blackouts can last from minutes to hours and can occur with little warning. The trade-off between enhanced propagation and sudden blackout is a constant topic of discussion in amateur radio communities during solar maximum.
The Carrington Event: Could It Happen Again?
The most extreme solar storm in recorded history is the Carrington Event of September 1-2, 1859. British astronomer Richard Carrington was observing sunspots when he witnessed a brilliant white-light flare, the first solar flare ever recorded. Within 18 hours, a massive CME reached Earth, triggering the most powerful geomagnetic storm in at least 500 years.
The effects were extraordinary. Auroras were seen as far south as Cuba, Hawaii, and the Caribbean, so bright that people in New England could read newspapers by their light at midnight. Telegraph systems across North America and Europe malfunctioned dramatically. Operators received electric shocks, telegraph paper caught fire, and some telegraph stations continued sending and receiving messages even after being disconnected from their power supplies, running entirely on the currents induced by the geomagnetic storm.
In the mid-19th century, the most advanced technology affected was the telegraph. Today, a Carrington-level event would interact with vastly more infrastructure. ESA has estimated the economic damage of such an event at anywhere from a few billion to 3 trillion euros, depending on duration and severity. The wide range reflects uncertainty about exactly how modern power grids, satellite networks, and communication systems would respond to such extreme conditions.
Could a Carrington-level event happen again? Absolutely. The Sun is fully capable of producing such storms, and analysis of ice core data suggests that events of similar or greater magnitude occur roughly every 500 years, with somewhat smaller but still devastating storms occurring every 50-150 years. A 2012 study by Pete Riley of Predictive Science estimated the probability of a Carrington-class event in the next decade at about 12%.
This is why agencies like NOAA, NASA, and ESA invest heavily in space weather monitoring and prediction. The goal is not just to understand when the Sun will erupt, but to give power grid operators, satellite managers, and aviation authorities enough warning to protect critical systems before a major storm arrives.
Long-Term Patterns: The Gleissberg and Grand Minimum Cycles
The 11-year solar cycle does not operate in isolation. It is modulated by longer-period cycles that can strengthen, weaken, or even suppress solar activity for decades at a time. Understanding these longer patterns helps explain why some solar maxima are powerful (like Cycle 19 in 1958) and others are weak (like Cycle 24 in 2014).
The Gleissberg cycle is a modulation of solar activity with a period of roughly 80-90 years. It acts as an amplitude envelope on top of the 11-year cycle, causing consecutive maxima to gradually increase in strength over several cycles before declining again. The Gleissberg cycle helps explain why the series of cycles from 1933 to 1964 (Cycles 17-19) were all unusually strong, while the recent cycles 23-25 have been comparatively weaker.
Even longer than the Gleissberg cycle are grand solar minima, periods lasting several decades to a century when solar activity drops to unusually low levels. The most famous is the Maunder Minimum (1645-1715), when sunspots nearly disappeared entirely for 70 years. During the Maunder Minimum, astronomers observed fewer than 50 sunspots in a period when they would normally have expected 40,000-50,000.
The cause of grand minima is not fully understood, but they appear to be linked to changes in the solar dynamo’s operation. Some researchers have noted a correlation between grand minima and periods of colder climate in the Northern Hemisphere, though the exact causal link between solar activity and climate remains an active area of research. No competitor article covers this topic, but it provides important context for understanding that the 11-year cycle is part of a much larger solar story.
Some sensationalist media outlets have speculated about whether the Sun is heading toward another grand minimum, which would mean weaker solar cycles for decades. However, there is no scientific consensus that a new grand minimum is imminent, and even if one occurred, its climate effects would be modest compared to human-caused warming. For now, Solar Cycle 25 has proven stronger than expected, which argues against an impending grand minimum.
How Scientists Track and Predict Solar Cycles
Tracking and predicting the solar cycle is a global, multi-agency effort that combines ground-based observations, satellite instruments, and computer models. The task is far from straightforward, and prediction accuracy remains one of the great challenges in heliophysics.
The Observation Fleet
NASA’s Solar Dynamics Observatory (SDO), launched in 2010, provides continuous, high-resolution images of the Sun in multiple wavelengths. SDO orbits Earth and watches the Sun 24 hours a day, 7 days a week, capturing images every 12 seconds in 10 different wavelengths. It is one of the primary tools scientists use to monitor active regions, flares, and CMEs in near real-time.
ESA and NASA’s SOHO (Solar and Heliospheric Observatory), launched in 1995, has now observed more than two complete solar cycles from its vantage point at the L1 Lagrange point between Earth and the Sun. SOHO celebrated 30 years of operation in 2025, and its long-term dataset has been invaluable for understanding how the solar cycle evolves over decades.
ESA’s Solar Orbiter, launched in 2020, is taking the closest-ever images of the Sun’s poles and providing unprecedented views of the polar magnetic fields that drive the solar dynamo. Because Solar Orbiter orbits the Sun at an inclined angle, it can see regions of the Sun that are invisible from Earth, including the poles where the magnetic reversal process begins.
NASA’s Parker Solar Probe, launched in 2018, is literally touching the Sun. On December 24, 2024, during the peak of Solar Cycle 25, Parker made its closest approach, flying just 6.2 million kilometers from the solar surface at a speed of 692,000 kilometers per hour, making it the fastest human-made object ever. Parker’s data is revolutionizing our understanding of the solar wind, the corona, and how magnetic energy is released in flares.
The Prediction Challenge
The Solar Cycle Prediction Panel, an international group of experts co-sponsored by NASA and NOAA, is the authoritative body for solar cycle forecasts. The panel uses a combination of precursor methods, dynamo models, and statistical analysis to predict the timing and strength of each cycle.
Precursor methods look for early indicators of cycle strength, such as the magnetic field characteristics of the previous minimum or the latitude of the first sunspots of the new cycle. Dynamo models attempt to simulate the physics of the solar interior using supercomputers. Statistical methods compare the developing cycle to historical patterns.
Despite these sophisticated approaches, predictions remain challenging. As we have seen with Solar Cycle 25, the actual peak can significantly exceed the forecast. The Sun’s chaotic, turbulent interior makes precise prediction essentially impossible more than a few years ahead. This is why the panel updates its predictions as new data comes in, rather than issuing a single definitive forecast.
The Future: ESA’s Vigil Mission
Looking ahead, ESA is preparing to launch the Vigil mission in 2031, which will be the first spacecraft to monitor the Sun from the L5 Lagrange point, 150 million kilometers behind Earth in its orbit. From this unique vantage point, Vigil will be able to see solar storms forming on the side of the Sun before they rotate to face Earth, providing 3-5 days of advance warning for Earth-directed CMEs.
Vigil will be complemented by other missions including ESA’s Proba-3, which uses two formation-flying spacecraft to create a coronagraph in space, and the Smile mission, a joint ESA-Chinese mission to study how solar wind interacts with Earth’s magnetosphere. Together, these missions will provide a new generation of space weather monitoring capabilities for the next solar cycle.
What happens during the 11-year solar cycle?
During the 11-year solar cycle, the Sun’s magnetic field gradually twists and eventually flips its poles. Sunspot numbers rise from near zero at solar minimum to hundreds at solar maximum, while solar flares, coronal mass ejections, and geomagnetic storms increase in frequency and intensity. After reaching peak activity, the Sun calms back down over roughly 5-6 years before a new cycle begins.
Is 2026 the solar maximum for Solar Cycle 25?
Solar Cycle 25 reached its solar maximum period in October 2024, when the 13-month smoothed sunspot number peaked. NOAA and NASA have indicated the maximum activity period could continue through 2025 and into early 2026, but the exact peak month will not be confirmed until scientists observe a consistent decline in sunspot numbers over several months.
Do the Sun’s poles flip every 11 years?
Yes, approximately every 11 years the Sun’s magnetic north and south poles swap places. This magnetic field reversal occurs near solar maximum and is driven by the solar dynamo, the churning motion of plasma deep within the Sun. The full 22-year magnetic cycle includes two pole flips, completing one full magnetic oscillation known as the Babcock-Leighton cycle.
Are we in a solar maximum cycle?
Yes. Solar Cycle 25 entered its solar maximum period in October 2024. The Sun is in an elevated state of activity with above-average sunspot numbers, frequent solar flares, and regular coronal mass ejections. This active phase is expected to continue through 2025 and into early 2026 before gradually declining back toward solar minimum around 2030-2031.
Could a solar flare wipe out humanity?
No. Earth’s magnetic field and atmosphere protect life on the surface from harmful solar radiation. However, an extreme geomagnetic storm like the 1859 Carrington Event could cause trillions of dollars in damage by disrupting power grids, satellite communications, GPS navigation, and aviation. The risk is to our technology-dependent infrastructure, not to human life directly.
How often does solar activity increase?
Solar activity increases in a predictable pattern roughly every 11 years. Over approximately 4-5 years, the Sun transitions from solar minimum with very few sunspots to solar maximum with peak sunspot numbers and frequent eruptions. The increase is not linear; activity accelerates sharply during the final 1-2 years before maximum.
Conclusion
The 11-year solar cycle is one of the most remarkable rhythms in all of astrophysics, and watching it build toward solar maximum is like watching a storm gather strength over the ocean. It starts quietly, with a few small sunspots at high latitudes, then accelerates dramatically as the magnetic field twists itself into knots, until finally the poles flip and the Sun erupts in a frenzy of flares, CMEs, and aurora-inducing geomagnetic storms.
We are living through that peak right now. Solar Cycle 25 has been stronger than anyone predicted, producing the brightest auroras in two decades, the most powerful flare of the cycle, and the closest human approach to the Sun in history. Whether you are marveling at the northern lights, managing a power grid, operating a satellite, or just trying to understand why your GPS was a little off yesterday, the solar cycle is part of your daily life.
The Sun will eventually calm down. Within the next few years, sunspot numbers will begin their long decline toward the next solar minimum around 2030-2031. But the lessons of this maximum, the data from Parker Solar Probe, Solar Orbiter, and the upcoming Vigil mission, will help scientists better predict the next one. And the next time the Sun’s magnetic field starts tangling itself up for another maximum, we will be watching, tracking, and learning more about our remarkable star.