
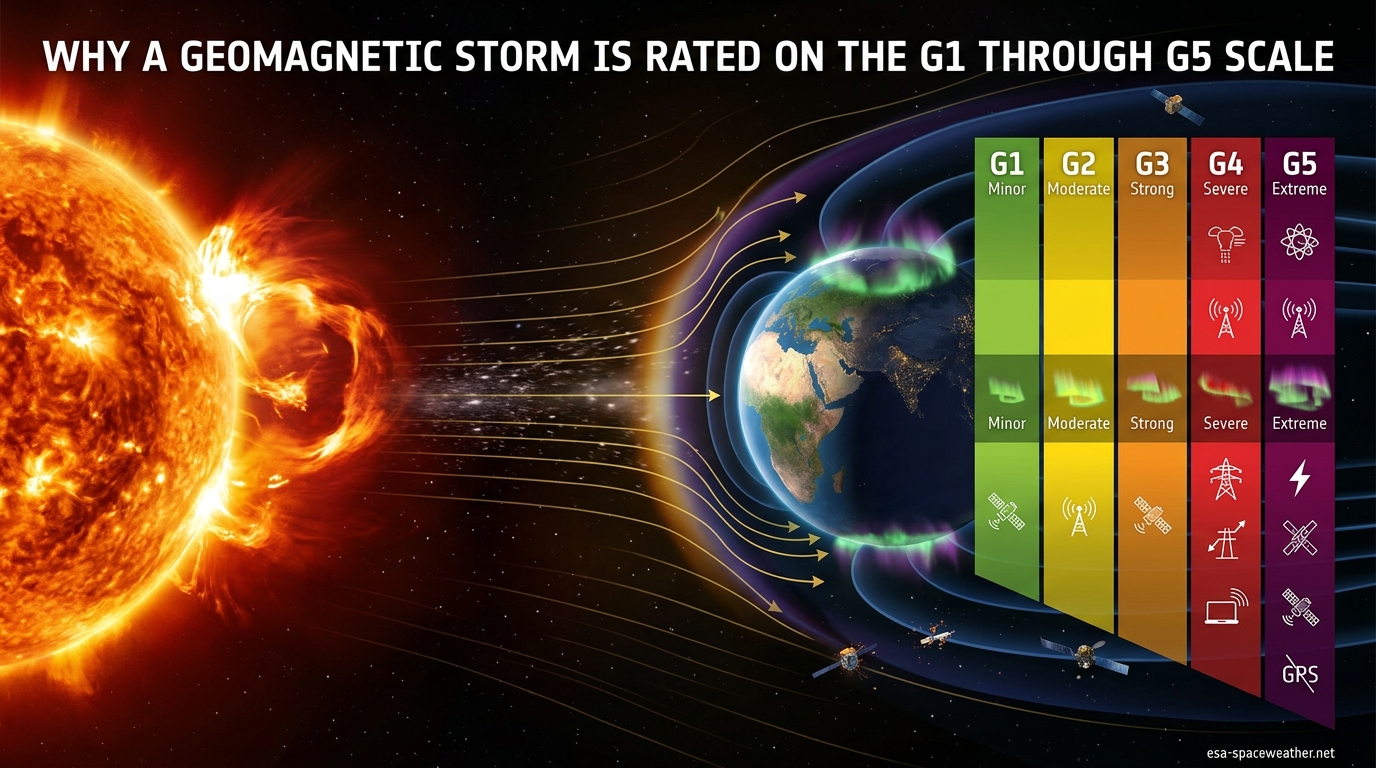
A geomagnetic storm is rated on the G1 through G5 scale because NOAA needed a simple, universal system to communicate how severely a solar disturbance could affect Earth’s technology, power grids, and aurora visibility. The geomagnetic storm G1 G5 scale translates complex space weather measurements into five clear categories, running from G1 (Minor) at Kp 5 to G5 (Extreme) at Kp 9, so that grid operators, satellite teams, and the public can quickly understand what is heading our way and how to prepare.
Our team has tracked space weather events for years, and the single question we hear most often is simple: why does this scale exist, and what do the numbers actually mean? In this guide, we break down the reasoning behind the G-scale, how each level maps to the Kp index, what effects you can expect at every tier, and why the design of the scale itself matters for how we respond to solar storms in 2026.
Table of Contents
What Is the G1 Through G5 Scale?
The G1 through G5 scale is part of the NOAA Space Weather Scales, a standardized rating system created by the National Oceanic and Atmospheric Administration’s Space Weather Prediction Center (NOAA SWPC). It categorizes geomagnetic storm intensity into five levels, with G1 representing a minor disturbance and G5 representing an extreme event capable of widespread infrastructure disruption.
NOAA introduced the space weather scales in 1999 specifically to solve a communication problem. Before the scales existed, space weather scientists described disturbances using raw data like Kp values, dst indices, and solar wind speeds. That meant almost nothing to a power grid dispatcher or an airline route planner who needed to make fast decisions. The G-scale bridges that gap by attaching plain-language descriptors and expected effects to each level.
The full NOAA Space Weather Scales actually cover three distinct categories of space weather disturbance:
- G-scale (G1-G5): Geomagnetic storms, which affect Earth’s magnetic field
- S-scale (S1-S5): Solar radiation storms, which affect satellites and high-altitude radiation exposure
- R-scale (R1-R5): Radio blackouts, which affect HF communications and GPS on the sunlit side of Earth
Each scale uses a similar five-level structure modeled loosely after the Saffir-Simpson hurricane scale and the Fujita tornado scale. The idea was to create something instantly recognizable. A G3 storm should feel as interpretable to an emergency manager as a Category 3 hurricane.
The G-scale specifically measures disturbances in Earth’s magnetosphere caused by changes in the solar wind. When a coronal mass ejection or a high-speed solar wind stream hits Earth’s magnetic field, it compresses and distorts the magnetosphere. The G-scale captures how intense that distortion is, based on the planetary K-index (Kp) measured by a global network of magnetometer stations.
The Complete G1 Through G5 Scale Comparison Table
The following table breaks down every level of the geomagnetic storm G1 G5 scale, including the Kp index value, aurora visibility range, infrastructure effects, and how frequently each level occurs during a typical 11-year solar cycle. This is the quick-reference table that NOAA uses to communicate storm severity.
| Scale | Descriptor | Kp Index | Aurora Latitude (magnetic) | Key Infrastructure Effects | Frequency Per 11-Year Cycle |
|---|---|---|---|---|---|
| G1 | Minor | Kp 5 | ~57 degrees (northern Michigan, Maine, southern Scandinavia, northern Scotland) | Weak power grid fluctuations; minor satellite drag; migratory animals affected | ~900 per cycle (about 1,700 days) |
| G2 | Moderate | Kp 6 | ~54 degrees (northern US, southern Canada, central Europe, Scotland) | Voltage alarms on high-latitude power systems; long-duration pipelines may experience induced currents; HF radio fades at high latitudes | ~360 per cycle (about 600 days) |
| G3 | Strong | Kp 7 | ~50 degrees (Pacific Northwest, Midwest, central Europe, southern UK) | GPS navigation degraded; satellite orientation problems; intermittent HF radio blackouts; voltage corrections needed on power systems | ~130 per cycle (about 200 days) |
| G4 | Severe | Kp 8 | ~45 degrees (much of the US, Europe, and southern Australia) | Widespread voltage control problems; protective systems may trigger; satellite navigation degraded for hours; HF radio disrupted on sunlit side | ~60 per cycle (about 60 days) |
| G5 | Extreme | Kp 9 | Below ~35 degrees (visible from Spain, Texas, northern Japan, southern Australia) | Widespread power grid collapse possible; transformer damage; satellite navigation out for days; HF radio blackouts across continents; aurora visible near the equator | ~4 per cycle (about 4 days) |
This table is the heart of the NOAA Space Weather Scales for geomagnetic activity. When NOAA issues a geomagnetic storm watch or warning, it always references one of these five levels. The Kp column matters because that is the underlying measurement that determines the G-level. When the planetary K-index reaches 5, the storm is classified as G1. When it hits 9, it becomes a G5.
The aurora latitude column tells you roughly how far south (in the Northern Hemisphere) or how far north (in the Southern Hemisphere) the northern or southern lights will be visible. This is measured in magnetic latitude, not geographic latitude, which is a distinction we explain later in this guide.
The frequency column deserves attention. A G1 storm happens roughly every few days during solar maximum. A G5 storm, by contrast, occurs only about four times per 11-year solar cycle. That rarity is exactly why G5 events make headlines when they do arrive.
Why the G-Scale Was Designed the Way It Is
The G-scale was designed as a five-level system because NOAA needed to balance scientific accuracy with practical communication. Five levels provide enough granularity to distinguish between meaningfully different impacts, while remaining simple enough for non-scientists to act on immediately. This is the same reasoning behind the five-category Saffir-Simpson scale for hurricanes, which NOAA explicitly used as a model.
Before 1999, there was no standardized way to communicate geomagnetic storm severity. Scientists talked about Kp values, Dst (disturbance storm time) indices, and solar wind parameters. A Kp of 7 meant nothing to a power grid operator deciding whether to reduce load on a transformer. The G-scale solved this by attaching a descriptor word (Minor, Moderate, Strong, Severe, Extreme) and a list of expected effects to each level.
The decision to map the G-scale to Kp 5 through 9 was based on impact thresholds, not arbitrary numbers. Here is why those specific values matter:
- Kp 5 (G1): This is the level where measurable effects on technology begin. Below Kp 5, geomagnetic activity is considered quiet or unsettled, with no practical impact on infrastructure.
- Kp 6-7 (G2-G3): At these levels, effects become increasingly noticeable. Power systems need active management, and HF radio users start experiencing disruptions.
- Kp 8-9 (G4-G5): These levels represent storms with the potential for significant damage. Grid operators take protective action, and satellite operators may switch to safe modes.
The scale was intentionally capped at G5 (Kp 9) because the Kp index itself maxes out at 9. The K-index is a quasi-logarithmic measure, meaning each step up represents a larger absolute change in the magnetic field. Kp 9 already represents the most extreme disturbance the scale can capture, so there is no G6.
Another design choice: the scale focuses on observed effects rather than solar causes. A solar flare is rated on a different scale (the R-scale for radio blackouts, or by its X-class classification). The G-scale only measures what happens when the disturbance reaches Earth. This means a powerful solar flare does not automatically translate to a high G-rating if the associated coronal mass ejection misses Earth entirely.
NOAA also designed the scale to be actionable. Each level comes with specific guidance about what different sectors should expect and do. Power grid operators get voltage management instructions. Satellite operators get drag and charging warnings. Aurora hunters get latitude visibility estimates. Emergency managers get a risk assessment they can communicate to the public without requiring a physics degree.
How the G-Scale Connects to the Kp Index
The Kp index is the backbone of the geomagnetic storm G1 G5 scale. It stands for the planetary K-index, and it is the measurement that directly determines which G-level a storm receives. Understanding how Kp works is essential to understanding why a storm is rated G1 versus G4.
The K-index itself was developed by German geophysicist Julius Bartels in 1938. It quantifies disturbances in the horizontal component of Earth’s magnetic field on a scale from 0 to 9, with 0 being perfectly quiet and 9 being an extreme disturbance. The index is quasi-logarithmic, meaning the difference between Kp 4 and Kp 5 is smaller in absolute magnetic field terms than the difference between Kp 8 and Kp 9.
To calculate the planetary K-index, NOAA uses data from 13 magnetic observatories spread across the globe, ranging from mid-latitudes to near-polar regions. Each station measures local magnetic field variations every three hours and reports a local K-index. NOAA then averages these to produce the planetary K-index, giving a global picture of geomagnetic activity.
The mapping from Kp to the G-scale is straightforward:
- G1 (Minor): Kp = 5
- G2 (Moderate): Kp = 6
- G3 (Strong): Kp = 7
- G4 (Severe): Kp = 8
- G5 (Extreme): Kp = 9
Kp values of 0 through 4 are considered sub-storm levels. They represent quiet to unsettled geomagnetic conditions with no significant impact on technology or aurora visibility beyond the normal polar regions. NOAA does not assign G-scale ratings to these levels because there are no practical effects to communicate.
One common source of confusion is the difference between the Kp forecast and the G-scale forecast. NOAA’s 3-Day Forecast shows predicted Kp values for three-hour intervals. A forecast Kp of 7 means a G3 storm is expected during that window. The G-scale is simply the communication layer on top of the underlying Kp measurement.
The science behind why Kp 5 is the storm threshold comes down to observable impacts. At Kp 5, the ring current (a torus of charged particles encircling Earth) intensifies enough to produce measurable effects on power systems and to push the auroral oval southward to about 57 degrees magnetic latitude. Below Kp 5, the magnetosphere is stable enough that no infrastructure effects are detectable.
What Causes Geomagnetic Storms: CMEs and Solar Wind
Geomagnetic storms happen when energy from the Sun disturbs Earth’s magnetosphere. The two primary triggers are coronal mass ejections (CMEs) and coronal hole high-speed streams. Both deliver energy and charged particles into near-Earth space, but they do it in different ways and on different timelines.
A coronal mass ejection is an explosive eruption from the Sun’s atmosphere that launches billions of tons of plasma and magnetic field into space. When a CME is directed at Earth, it travels at speeds ranging from 400 to 3,000 kilometers per second and typically arrives within 15 to 72 hours. CMEs are the most common cause of major geomagnetic storms (G3 and above) because they carry a large amount of magnetic energy.
The key factor in how strong a CME-driven storm becomes is something called the Bz orientation. Bz refers to the direction of the interplanetary magnetic field carried by the CME. When Bz points strongly southward (negative), it aligns opposite to Earth’s northward magnetic field. This opposition triggers magnetic reconnection at the dayside magnetopause, allowing solar wind energy to pour into the magnetosphere. A southward Bz is the single most important factor in determining whether a CME produces a major storm or fizzles out.
Coronal hole high-speed streams are the second major cause. Coronal holes are regions of open magnetic field on the Sun’s surface where solar wind escapes at higher speeds than the normal slow solar wind. When a high-speed stream overtakes slower wind ahead of it, it creates a compression region called a co-rotating interaction region. When this compressed, turbulent plasma reaches Earth, it can trigger geomagnetic storms.
High-speed streams tend to produce G1 or G2 storms more frequently than CMEs, but they rarely cause G4 or G5 events. They are also more predictable because coronal holes can persist for months and rotate with the Sun’s roughly 27-day rotation period. This means a coronal hole stream can cause recurrent geomagnetic activity that repeats every 27 days.
A critical misconception we see frequently in space weather communities is that a big solar flare always means a big geomagnetic storm. This is not true. A solar flare is an electromagnetic burst (light and X-rays) that arrives at Earth in about 8 minutes. It can cause a radio blackout (rated on the R-scale), but a flare does not produce a geomagnetic storm by itself. Only if the flare is accompanied by an Earth-directed CME does a geomagnetic storm become possible. Many powerful flares produce no CME at all, or the CME heads in a different direction.
Infrastructure Effects at Each Storm Level
The geomagnetic storm G1 G5 scale exists primarily to communicate impacts on technology and infrastructure. Each level carries a specific set of expected effects that help operators decide what actions to take. Here is what happens at each tier.
G1 (Minor) Effects
At G1, weak power grid fluctuations are possible. These are generally not harmful but may trigger monitoring alarms at high-latitude power stations. Satellite drag increases slightly, which can affect orbital predictions for low-Earth-orbit satellites. Migratory animals that navigate by magnetic sensing may begin to show disorientation. Aurora becomes visible at high latitudes, typically around 57 degrees magnetic latitude.
For most people, a G1 storm is invisible. It produces beautiful aurora for observers in places like northern Scotland, southern Scandinavia, northern Canada, and Alaska. No protective action is typically required for infrastructure.
G2 (Moderate) Effects
G2 storms produce voltage alarms on high-latitude power systems. Operators may need to take corrective action to maintain stable voltage. Long-distance pipelines, particularly those running north-south, may experience induced currents that accelerate corrosion over time. HF radio communications at high latitudes can fade, affecting aviation and maritime routes in polar regions.
Satellite operations see increased drag, requiring more frequent orbit corrections. Aurora pushes further south, becoming visible from the northern United States, southern Canada, and central Europe.
G3 (Strong) Effects
At G3, the effects become significant enough for active mitigation. Power systems at mid-latitudes may require voltage corrections. Satellite orientation systems can experience problems as the expanded atmosphere increases drag and changes the spacecraft’s orientation. Intermittent HF radio blackouts occur, and GPS navigation accuracy degrades noticeably.
This is the level where aurora hunters in the Pacific Northwest, the US Midwest, central Europe, and the southern UK have a good chance of seeing the northern lights. G3 storms happen roughly 130 times per solar cycle, or about once every few weeks during solar maximum.
G4 (Severe) Effects
G4 storms can cause widespread voltage control problems across power systems. Some protective systems may automatically trigger, potentially leading to localized power outages if grid operators are not prepared. Satellite navigation systems degrade for hours, and HF radio communication is disrupted across large areas of the sunlit hemisphere.
Satellite operators face increased risk of surface charging and single-event upsets. Aurora at this level is visible from much of the United States, Europe, and as far south as southern Australia in the Southern Hemisphere. G4 events occur about 60 times per solar cycle.
G5 (Extreme) Effects
G5 is the highest level on the scale, and the effects can be severe. Widespread voltage control problems and power grid collapse are possible. Transformers can suffer permanent damage from geomagnetically induced currents, potentially leading to long-duration power outages. Satellite navigation systems may be out for days. HF radio communication is disrupted across entire continents.
In March 1989, a G5 storm caused the entire Hydro-Quebec power grid to collapse in just 90 seconds, leaving 6 million people without electricity for up to 9 hours. During the May 2024 G5 storm, aurora was visible from locations as far south as Texas, Florida, Spain, and Japan. It was the strongest geomagnetic storm to hit Earth since the Halloween storms of 2003.
Despite the severity, G5 storms do not directly harm humans. Earth’s atmosphere and magnetic field protect us from the charged particles and radiation. The danger is to technology, not biology.
Aurora Visibility at Each G-Level
One of the most popular reasons people follow the geomagnetic storm G1 G5 scale is to know when and where aurora will be visible. Each G-level corresponds to a specific magnetic latitude range where the northern or southern lights become observable.
It is important to understand the difference between geographic latitude and magnetic latitude. Geographic latitude is what you see on a map. Magnetic latitude is based on Earth’s magnetic field, which is tilted and offset from the rotational pole. This means that two cities at the same geographic latitude can have different magnetic latitudes.
For example, Minneapolis, Minnesota sits at about 45 degrees geographic latitude but around 55 degrees magnetic latitude. London is at 51 degrees geographic latitude but roughly 49 degrees magnetic latitude. This is why London sees aurora more often than Minneapolis despite being further south geographically.
Here is how aurora visibility shifts with each G-level:
- G1 (Kp 5): Aurora visible at approximately 57 degrees magnetic latitude. This includes northern Michigan, Maine, northern Scotland, southern Scandinavia, and southern New Zealand.
- G2 (Kp 6): Aurora pushes to about 54 degrees magnetic latitude. Visible from the northern United States, southern Canada, central Scotland, and Denmark.
- G3 (Kp 7): Aurora reaches about 50 degrees magnetic latitude. This brings the northern lights into view from the Pacific Northwest, the northern Midwest, central Europe, and the southern UK.
- G4 (Kp 8): Aurora drops to roughly 45 degrees magnetic latitude. Much of the United States, central and southern Europe, and southern Australia can see aurora.
- G5 (Kp 9): Aurora visible below 35 degrees magnetic latitude. The northern lights have been observed from Spain, Texas, northern Japan, Hawaii, and the Caribbean during G5 events.
The auroral oval, the ring-shaped zone around each magnetic pole where aurora typically forms, expands equatorward as storm intensity increases. At G1, the oval sits near 67 degrees magnetic latitude. At G5, it can expand to cover areas as far south as 40 degrees, bringing aurora to regions that almost never see it.
Storm Frequency and the 11-Year Solar Cycle
The frequency of geomagnetic storms at every G-level is tied directly to the 11-year solar cycle. During solar maximum, when the Sun is most active, storms occur more frequently and tend to be stronger. During solar minimum, geomagnetic activity drops significantly.
The Sun’s magnetic field flips polarity approximately every 11 years. Each cycle brings a peak in sunspot numbers, solar flares, and CMEs, followed by a quiet period. Solar Cycle 25, the current cycle as of 2026, began in late 2019 and reached its maximum in 2024-2025, producing several notable storms including the May 2024 G5 event.
Here is how often each G-level typically occurs during one 11-year solar cycle, averaged across the full cycle:
- G1: About 900 storms (roughly 1,700 days of activity)
- G2: About 360 storms (roughly 600 days)
- G3: About 130 storms (roughly 200 days)
- G4: About 60 storms (roughly 60 days)
- G5: About 4 storms (roughly 4 days, averaged across the cycle)
These numbers are averages. During solar maximum, G1 and G2 storms can happen multiple times per month. During solar minimum, weeks can pass with no geomagnetic activity above G1.
The frequency numbers reflect the entire cycle, including quiet periods. If you focus only on the 2-3 years around solar maximum, the rate of significant storms (G3 and above) is much higher. The May 2024 G5 storm occurred during the rising phase of Solar Cycle 25’s maximum and was accompanied by several G3 and G4 events in the surrounding weeks.
Notable historical G5 events include the Carrington Event of 1859 (the strongest recorded geomagnetic storm), the March 1989 Quebec blackout storm, the 2003 Halloween storms, and the May 2024 storm. These events serve as reference points for what each extreme level looks like in practice.
How ESA and International Agencies Use the G-Scale
The geomagnetic storm G1 G5 scale was developed by NOAA in the United States, but it has been adopted as a de facto international standard. Space weather agencies worldwide, including the European Space Agency (ESA), the South African National Space Agency (SANSA), the Australian Bureau of Meteorology’s Space Weather Services, and the UK Met Office Space Weather Operations Centre, all reference the same five-level G-scale in their forecasts and alerts.
ESA operates its own space weather service through the Space Safety Programme, which provides monitoring and forecasting tailored to European needs. ESA’s network includes data from satellites like SOHO (Solar and Heliospheric Observatory), Proba-2, and the upcoming Lagrange mission, which will place monitoring spacecraft at the L5 point for an side-on view of the Sun-Earth line.
The DSCOVR satellite, operated by NOAA, sits at the L1 Lagrange point about 1.5 million kilometers sunward of Earth. It provides real-time measurements of solar wind speed, density, and magnetic field orientation (including the critical Bz value). This data feeds into the models that NOAA, ESA, and other agencies use to issue G-scale alerts. ESA supplements this with its own measurements and with ground-based magnetometer networks across Europe.
The reason international agencies use the same scale is simple: space weather does not respect national borders. A CME that triggers a G4 storm over North America will also affect Europe within hours. A shared scale means that a G3 alert issued by NOAA is instantly understood by grid operators in Germany, satellite controllers in Japan, and aviation authorities in Australia.
ESA and NOAA also coordinate through the International Space Environment Service (ISES), a global network of regional space weather warning centers. ISES ensures that warnings are consistent and that data flows freely between agencies. This coordination was especially visible during the May 2024 G5 storm, when agencies worldwide issued synchronized alerts that gave infrastructure operators hours of advance warning.
For European users, ESA’s Space Weather Service offers a dedicated portal with real-time data, forecasts, and G-scale alerts. The service covers not just geomagnetic storms but also solar radiation and radio blackout events, mirroring NOAA’s three-scale system. SANSA provides similar services for Africa and the Southern Hemisphere, while the Australian Bureau of Meteorology covers the Oceania region.
How NOAA Issues Geomagnetic Storm Watches, Warnings, and Alerts
NOAA uses a three-tier system to communicate geomagnetic storm threats, and understanding this system helps you know what to expect when you see a G-scale rating in the news. The three tiers are watches, warnings, and alerts, each representing a different level of certainty and urgency.
A geomagnetic storm watch is issued when conditions are favorable for a storm but it has not yet arrived. Watches are typically issued 1 to 3 days in advance, based on observations of CMEs on the Sun or the detection of a high-speed stream approaching Earth. A watch means you should prepare but the storm may not materialize. CME arrival times can be off by 12 hours or more, and the intensity depends heavily on the Bz orientation, which cannot be measured until the CME is close to Earth.
A geomagnetic storm warning means a storm is imminent or already beginning. Warnings are issued when the DSCOVR satellite at the L1 point detects the CME or high-speed stream arriving, typically 30 to 60 minutes before it reaches Earth. At this point, the Bz orientation and solar wind speed can be measured directly, giving a much better estimate of the likely G-level.
A geomagnetic storm alert means the storm is happening now. Alerts are issued when ground-based magnetometers detect the Kp index rising to or above 5, confirming that geomagnetic activity has reached at least G1. As the storm intensifies, NOAA updates the alert with the current G-level.
The challenge with geomagnetic storm forecasting is that the Bz orientation, the single most important factor in determining storm intensity, cannot be reliably predicted until the solar plasma is almost at Earth. The DSCOVR satellite at L1 gives only 30-60 minutes of lead time. This is why watches often come with wide uncertainty ranges. A watch might say G2-G4 expected, because the actual level depends on factors that will only be measurable hours later.
To monitor current conditions yourself, NOAA’s 3-Day Forecast shows predicted Kp values in three-hour intervals, which directly correspond to expected G-levels. The forecast is updated multiple times per day as new data arrives from solar observatories and the L1 monitoring satellite.
FAQs
How bad is a G5 geomagnetic storm?
A G5 geomagnetic storm is the most extreme level on the NOAA scale and can cause widespread power grid voltage control problems, possible transformer damage, satellite navigation outages lasting for days, and HF radio blackouts across entire continents. Aurora becomes visible at latitudes as far south as Texas, Spain, and Japan. Despite the severity, G5 storms do not pose a direct biological risk to humans thanks to Earth’s protective atmosphere and magnetic field.
What does G1 mean for aurora?
A G1 geomagnetic storm pushes aurora to approximately 57 degrees magnetic latitude, making the northern lights visible from northern Michigan, Maine, northern Scotland, southern Scandinavia, and southern New Zealand. G1 is the lowest storm level and produces the least expansive aurora, but for high-latitude observers it still provides a good viewing opportunity.
What is the G1 G5 scale?
The G1 G5 scale is NOAA’s five-level system for rating geomagnetic storm intensity. It runs from G1 (Minor, Kp 5) to G5 (Extreme, Kp 9) and maps each level to specific effects on power systems, satellite operations, radio communications, and aurora visibility. The scale was created in 1999 to communicate space weather severity in a format similar to the Saffir-Simpson hurricane scale.
What would happen if a G5 solar storm hit Earth?
If a G5 solar storm hit Earth, it could cause widespread power grid disruptions including transformer damage, satellite navigation outages lasting days, and HF radio blackouts across continents. Aurora would be visible from latitudes as far south as 35 degrees magnetic, including parts of Spain, Texas, and Japan. The March 1989 G5 storm collapsed the entire Hydro-Quebec power grid in 90 seconds. However, the storm would not cause direct harm to humans on the ground.
What does a geomagnetic storm index rating of 5 indicate?
A geomagnetic storm index rating of 5 indicates the most extreme level of geomagnetic activity on the NOAA G-scale, corresponding to a Kp index of 9. At this level, widespread infrastructure effects are expected including power grid problems, satellite navigation degradation, and aurora visible at unusually low latitudes. A Kp of 5 (which corresponds to G1, not G5) indicates the threshold where geomagnetic activity becomes a recognized storm.
How long does a geomagnetic storm last?
A geomagnetic storm typically lasts between 12 and 48 hours, though the duration varies depending on the cause. CME-driven storms often produce a sudden commencement followed by a main phase lasting several hours and a recovery phase that can extend over one to two days. Coronal hole high-speed streams can sustain G1-G2 conditions for a week or more because the stream persists as the Sun rotates.
Are geomagnetic storms dangerous to humans?
Geomagnetic storms are not directly dangerous to humans on the surface of Earth. The planet’s atmosphere and magnetic field shield us from the charged particles and electromagnetic energy involved. The danger is to technology: power grids, satellites, GPS systems, and radio communications can all be affected. Astronauts in space and passengers on high-altitude polar flights during S-scale solar radiation storms face elevated radiation exposure, but this is a separate phenomenon from geomagnetic storms.
When was the last G5 geomagnetic storm?
The last confirmed G5 geomagnetic storm occurred on May 10-11, 2024, during the approach to the Solar Cycle 25 maximum. It was triggered by a series of Earth-directed CMEs from a large sunspot region and produced aurora visible from Texas, Florida, Spain, Japan, and many other locations that rarely see the northern lights. It was the strongest geomagnetic storm since the 2003 Halloween storms.
Key Takeaways on the G1 Through G5 Scale
The geomagnetic storm G1 G5 scale exists because space weather is too complex and too consequential to communicate with raw data alone. By mapping Kp index values to five clear levels with plain-language descriptors and specific expected effects, NOAA created a system that everyone from power grid operators to aurora hunters can understand and act on.
Each level on the scale tells you three things at a glance: how intense the magnetic disturbance is, what infrastructure effects to expect, and how far south the aurora will reach. That simplicity is the entire point of the design. A G3 alert means the same thing whether you are reading it in Oslo, Texas, or Tokyo.
If you want to stay informed about current and upcoming geomagnetic activity, NOAA’s 3-Day Forecast is updated continuously, and ESA’s Space Weather Service provides monitoring and alerts for European users. Both services use the same G-scale, so you can rely on either source for consistent information about why a geomagnetic storm is rated on the G1 through G5 scale and what it means for you.