
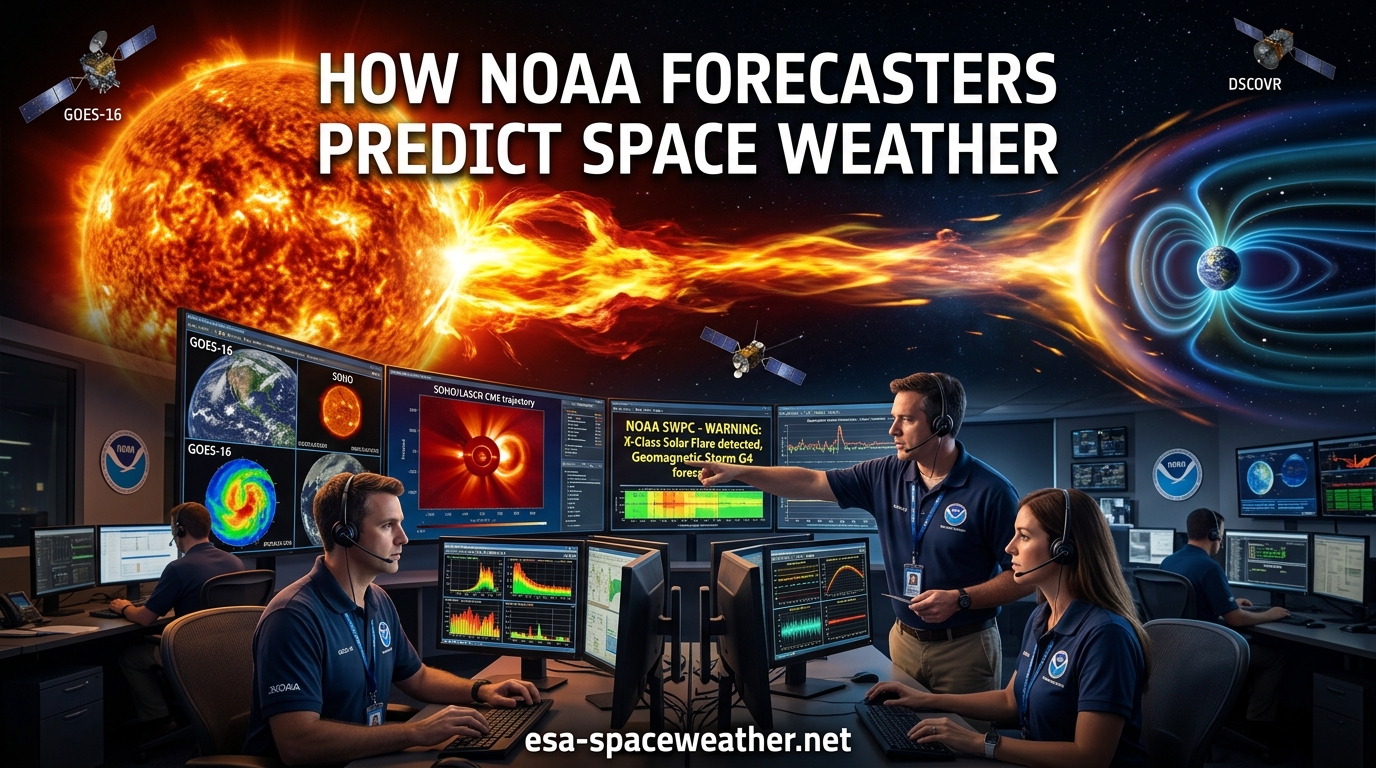
Every day, a small team of scientists at a federal facility in Boulder, Colorado, watches the Sun so the rest of us do not have to. They track invisible explosions on a star 93 million miles away and translate that chaos into alerts that protect power grids, satellites, GPS signals, and astronauts. Understanding how forecasters at NOAA predict space weather day to day reveals a fascinating mix of cutting-edge satellites, decades-old forecasting techniques, and human judgment under pressure.
NOAA’s Space Weather Prediction Center (SWPC) is the official U.S. government source for space weather alerts, watches, and warnings. Their forecasters monitor the Sun around the clock using a global network of satellites and ground-based observatories. They analyze real-time data, compare it to historical patterns, run it through numerical models, and issue forecasts ranging from a few hours to 45 days in advance.
In this guide, we walk through the entire process. You will learn what space weather actually is, the specific instruments NOAA forecasters rely on, the step-by-step forecasting pipeline, and why predicting a solar storm is so much harder than predicting a thunderstorm. Whether you are an aurora chaser, a satellite operator, or simply curious about the science, here is exactly how NOAA forecasters predict space weather day to day.
Table of Contents
What Is Space Weather?
Space weather refers to the dynamic conditions on the Sun and in the solar wind, magnetosphere, ionosphere, and thermosphere that can influence the performance and reliability of space-borne and ground-based technological systems. Unlike terrestrial weather, which we feel as rain or wind, space weather is invisible to our senses but capable of crippling entire power grids.
The Sun drives all space weather through several key phenomena. Solar flares are sudden bursts of electromagnetic radiation that travel at the speed of light, reaching Earth in about eight minutes. Coronal mass ejections, or CMEs, are enormous eruptions of plasma and magnetic field that take one to three days to reach our planet. High-speed solar wind streams from coronal holes can also trigger geomagnetic activity, typically arriving in two to four days.
When these solar events reach Earth, they interact with our magnetosphere and ionosphere. The result can be geomagnetic storms that overload power transformers, solar radiation storms that endanger astronauts and disrupt satellite electronics, and radio blackouts that knock out high-frequency communications on the dayside of Earth. The Kp-index, a scale from 0 to 9, quantifies geomagnetic disturbance intensity and is one of the most-watched numbers in space weather forecasting.
NOAA’s Space Weather Prediction Center: The Authoritative Source
The Space Weather Prediction Center, located in Boulder, Colorado, is part of NOAA’s National Weather Service. It is the nation’s official source of space weather alerts, watches, and warnings, operating 24 hours a day, 365 days a year. SWPC forecasters serve as the front line of defense against solar activity that could disrupt critical infrastructure.
SWPC serves a wide range of customers. Power grid operators use their alerts to protect transformers from geomagnetically induced currents. Satellite operators rely on solar radiation forecasts to put spacecraft into safe modes. Airlines use space weather guidance to reroute polar flights away from communication dead zones and radiation hazards. Emergency managers, the Department of Defense, and NASA all depend on SWPC products to safeguard operations and personnel.
What sets SWPC apart from enthusiast sites is its role as the official government voice. When SWPC issues a G3 geomagnetic storm warning, power companies take action based on that alert. The center’s authority comes from decades of operational experience, direct access to government satellite data, and a mandate to protect life and property.
The Tools NOAA Forecasters Use Every Day
Forecasters at NOAA cannot see space weather by looking out a window. They depend on a constellation of satellites and a network of ground-based observatories that feed data into SWPC’s operations center in near-real-time. Here are the primary instruments in their toolkit.
Satellites That Watch the Sun
GOES satellites, operated by NOAA in geostationary orbit, carry X-ray sensors that detect solar flares the moment they erupt. The GOES X-ray flux is the first indicator a forecaster checks when a flare occurs, because it provides the flare class (C, M, or X) that determines severity.
The ACE satellite, positioned at the L1 Lagrange point about one million miles upstream of Earth, measures the solar wind in real-time. ACE provides data on solar wind speed, density, temperature, and the critical interplanetary magnetic field components. When a CME arrives at ACE, forecasters have roughly 30 to 60 minutes of warning before it hits Earth’s magnetosphere.
DSCOVR, which replaced ACE as the primary space weather buoy at L1 in 2016, continues this vital early-warning mission. SOHO and SDO provide continuous imaging of the Sun’s surface and corona. SOHO’s LASCO coronagraph blocks out the Sun’s bright disk so forecasters can see CMEs erupting into space. SDO delivers detailed multispectral images of sunspots, active regions, and solar flares.
Ground-Based Observatories
NOAA also relies on a worldwide network of ground-based sensors. USAF-sponsored optical observatories monitor sunspots and produce daily sunspot numbers. Magnetometers at stations across the globe measure geomagnetic disturbances and feed data into the Kp-index calculation.
The K-Coronagraph at the Mauna Loa Solar Observatory in Hawaii provides ground-based coronal observations to complement satellite imagery. Riometers measure ionospheric absorption, helping forecasters assess radio blackout conditions. Together, this combination of space-based and ground-based observations gives SWPC a continuous picture of the solar-geophysical environment.
The Daily Forecasting Process: Step by Step
Understanding how NOAA forecasters predict space weather day to day means following a structured process that repeats every shift, every day. Here is the step-by-step pipeline.
Step 1: Continuous Observation
The day begins with data review. Forecasters arriving for their shift scan the latest satellite imagery, X-ray flux readings, solar wind parameters from L1, and ground-based magnetometer data. They look for active sunspot regions, new solar flares, CME signatures in coronagraph imagery, and any sudden changes in solar wind speed or the interplanetary magnetic field.
This observation phase never stops. Automated systems alert forecasters the moment a significant flare occurs or when solar wind parameters cross key thresholds. During solar maximum, the pace can be relentless.
Step 2: Analysis and Characterization
Once an event is detected, forecasters characterize it. For a solar flare, they confirm the class and location on the Sun’s disk. For a CME, they analyze coronagraph imagery to determine speed, direction, and whether it is Earth-directed. They assess the source active region’s complexity and magnetic configuration.
This is where human expertise matters most. Two CMEs with similar apparent speed can have vastly different impacts depending on their magnetic orientation. A southward-pointing interplanetary magnetic field (negative Bz) couples efficiently with Earth’s magnetosphere and triggers strong geomagnetic storms. Forecasters know this, but predicting Bz orientation in advance remains one of the hardest problems in the field.
Step 3: Numerical Modeling
SWPC forecasters run observed CME parameters through numerical models to predict arrival time and potential impact. The primary model is WSA-Enlil, a physics-based simulation that takes CME speed, direction, and width as inputs and computes the CME’s propagation through the solar wind to Earth.
WSA-Enlil produces an estimated arrival time and a forecast of solar wind conditions upon impact. Forecasters interpret the model output alongside their own analysis, recognizing that models have limitations. Ensemble runs help quantify uncertainty by varying input parameters slightly and showing a range of possible outcomes.
Step 4: Forecast Product Generation
Based on their analysis and model output, forecasters generate a suite of products. The 3-Day Forecast predicts geomagnetic activity levels for the next three days using the Kp-index. The Forecast Discussion provides plain-language context explaining what the Sun is doing and why certain activity levels are expected.
For detected events, forecasters issue alerts, watches, or warnings depending on severity and lead time. They also update the 27-day outlook, which uses the Sun’s 27-day rotational period to predict when known active regions or coronal holes will face Earth again.
Step 5: Monitoring and Updating
Forecasts are living products. As new data arrives, forecasters revise their predictions. If a CME arrives earlier or later than modeled, they update the geomagnetic storm timeline. If solar wind conditions intensify beyond expectations, they escalate alert levels. This continuous loop of observation, analysis, and updating defines the day-to-day rhythm at SWPC.
The WSA-Enlil Model and Persistence Forecasting
Two forecasting approaches dominate day-to-day operations at SWPC: numerical modeling and persistence forecasting based on the 27-day solar rotation.
WSA-Enlil in Plain Language
WSA-Enlil is actually two models working together. The WSA (Wang-Sheeley-Arge) component models the background solar wind from the Sun to Earth. The Enlil component simulates how a specific CME propagates through that background solar wind. Together, they produce a time-of-arrival forecast for Earth-directed CMEs.
The model takes CME parameters derived from coronagraph imagery, typically speed estimates and angular width, and runs a simulation that takes about an hour to complete. The output shows the CME’s density, velocity, and magnetic field at Earth as a function of time. Forecasters use this to predict when geomagnetic activity will begin and how intense it might be.
WSA-Enlil has improved CME arrival time forecasts significantly compared to simple empirical estimates. However, it cannot reliably predict the magnetic orientation of the arriving CME, which is the dominant factor controlling storm intensity. This limitation is why timing forecasts are generally more accurate than intensity forecasts.
The Power of the 27-Day Solar Rotation
The Sun rotates on its axis roughly every 27 days as seen from Earth. Active regions and coronal holes that face us today will rotate to the far side and then return to face Earth again about 27 days later. This recurrence pattern is the backbone of extended-range space weather forecasting.
Persistence forecasting simply assumes that an active region will behave similarly when it returns. If a coronal hole produced a high-speed solar wind stream that caused a G2 storm this rotation, SWPC’s 27-day outlook will flag a similar possibility next rotation. This approach is imperfect because active regions evolve, but it provides valuable lead time for planning.
The 45-day forecast extends this concept further, combining recurrence patterns with known coronal hole locations and historical active region behavior. It is less precise than short-term forecasts but gives satellite operators and power companies a window for resource planning.
NOAA Space Weather Scales and the Alert System
SWPC communicates threat levels using the NOAA Space Weather Scales, which classify events into three categories. Each category uses a 1 to 5 severity scale.
The G-scale covers geomagnetic storms, from G1 (minor) to G5 (extreme). A G1 storm can cause weak power grid fluctuations and minor aurora at high latitudes. A G5 storm, like the 2003 Halloween storms, can cause widespread voltage control problems, grid collapse, and aurora visible as far south as Florida.
The S-scale covers solar radiation storms, driven by solar energetic particles. S1 storms pose little risk, while S5 storms can expose high-flying aircraft and astronauts to dangerous radiation levels and cause satellite instrument damage.
The R-scale covers radio blackouts, caused by X-ray and extreme ultraviolet radiation from solar flares. R1 causes minor degradation of high-frequency radio on the sunlit side of Earth. R5 causes a complete HF radio blackout lasting for hours on the entire dayside.
Watches, Warnings, and Advisories
SWPC uses three alert levels that can confuse newcomers. A watch means conditions are favorable for an event within the next few days. A warning means an event is occurring or imminent and customers should take protective action immediately. An advisory indicates a minor event is in progress but is unlikely to cause significant impact.
This three-tier system mirrors the structure used in terrestrial weather forecasting, which helps bridge the gap for customers already familiar with National Weather Service products. Forum users on Reddit and SpaceWeatherLive frequently discuss the distinction, with some noting that NOAA tends to issue advisories where enthusiast sites show more dramatic warnings.
A Day in the Life of a SWPC Forecaster
Based on SWPC operational descriptions and community discussions, here is what a typical shift looks like.
A forecaster arrives for a 12-hour shift at the SWPC operations floor in Boulder. The first task is the shift handoff, where the outgoing forecaster briefs them on active sunspot regions, ongoing CMEs in transit, and any alerts currently in effect. This handoff is critical because space weather does not pause for shift changes.
Throughout the shift, the forecaster monitors multiple data streams simultaneously on a wall of displays. Solar imagery from SDO updates continuously. X-ray flux from GOES streams in real-time. Solar wind data from DSCOVR at L1 refreshes every few minutes. If a significant flare erupts, an alarm sounds and the forecaster has minutes to characterize it and determine whether an immediate alert is needed.
Forecasters collaborate constantly. When a major CME is detected, multiple team members confer on coronagraph analysis, model input parameters, and alert wording. The forecast discussion they write must be technically precise yet understandable to the power grid operators, airline dispatchers, and emergency managers who read it. Forecasters also field phone calls from key customers during significant events.
Shift work means forecasters work nights, weekends, and holidays. During solar maximum, when the Sun is most active, the pace intensifies dramatically. The job demands deep knowledge of solar physics, magnetospheric physics, and ionospheric physics, combined with the ability to make rapid decisions under pressure.
Forecast Accuracy and Limitations
One of the most common questions on forums like Reddit’s r/spaceweather is how accurate NOAA space weather forecasts really are. The honest answer is that accuracy depends heavily on what you are measuring.
CME arrival time forecasts have improved significantly with WSA-Enlil, with typical errors of plus or minus 6 to 12 hours. This means if a CME is forecast to arrive at 2:00 AM, it could arrive anywhere from early evening the previous day to midday the following day. For satellite operators preparing for a storm, this window is workable but far from precise.
Intensity forecasts are the bigger challenge. Even when a CME arrives on time, predicting whether it will trigger a G2 storm or a G4 storm depends on its magnetic orientation, which current models cannot reliably predict until the CME reaches L1, about 30 to 60 minutes before impact. By then, there is little time to take protective action.
This limitation explains why NOAA forecasts often seem more conservative than media reports or enthusiast predictions. SWPC forecasters are bound by an operational mandate to avoid false alarms that could cost industries millions in unnecessary preparations. When in doubt, they wait for L1 confirmation before escalating alert levels.
Persistence-based forecasts from the 27-day outlook have meaningful but limited skill. Active regions evolve between rotations, and coronal hole geometry changes. The 45-day forecast offers directional guidance rather than specific event prediction. Forecasters are transparent about these limitations in their discussions, which is why enthusiasts value reading the forecast discussion itself rather than just the headline alert.
The Solar Cycle’s Role in Daily Forecasting
The Sun follows an approximately 11-year cycle of activity, swinging between solar minimum and solar maximum. This cycle fundamentally shapes the day-to-day workload at SWPC.
During solar minimum, the Sun is quiet. Few sunspots appear, CMEs are rare, and forecasters spend more time monitoring coronal holes and their recurrent high-speed wind streams. The 27-day outlook becomes the primary forecasting tool during these quiet periods.
During solar maximum, the picture changes dramatically. Multiple active regions can pepper the Sun simultaneously, producing frequent flares and CMEs. Forecasters may track several Earth-directed CMEs at once, running multiple WSA-Enlil simulations and issuing a steady stream of alerts. The complexity of modeling interacting CMEs adds another layer of difficulty.
We are currently in Solar Cycle 25, which has been more active than initially predicted. This means SWPC forecasters have been busier than expected, with frequent M-class and X-class flares, multiple geomagnetic storm events, and heightened demand for accurate alerts. The solar cycle phase directly determines whether a forecaster’s shift is routine or intense.
AI and the Future of Space Weather Prediction
Artificial intelligence and machine learning are beginning to transform how NOAA forecasters predict space weather day to day. These technologies do not replace human forecasters, but they are becoming powerful tools for pattern recognition and rapid analysis.
Machine learning models trained on decades of solar imagery can now detect sunspot regions likely to produce major flares before eruption. AI-assisted CME detection algorithms scan coronagraph data faster than a human can, flagging potential events automatically. Researchers are also developing neural networks to predict geomagnetic storm intensity from L1 solar wind data, potentially giving forecasters more than the current 30 to 60 minutes of lead time.
The CCOR (Compact Coronagraph) instruments on upcoming GOES satellites will provide improved CME tracking with lower latency. Enhanced ground-based observatories and potential new missions like a space weather monitor at the L5 point could eventually allow forecasters to see the side of CMEs currently hidden from our vantage point.
Despite these advances, the fundamental challenge remains: space weather forecasting will always require human judgment. Models provide guidance, but the decision to issue a warning that triggers protective action at nuclear power plants or military installations demands accountability that only a trained forecaster can provide.
How to Read NOAA Space Weather Forecasts Yourself
If you want to follow along with what NOAA forecasters are seeing, the SWPC website makes most data publicly available. The 3-Day Forecast shows predicted Kp values in three-hour blocks, giving you a sense of when geomagnetic activity is expected to peak. The Forecast Discussion is written in accessible language and provides the reasoning behind each forecast.
For aurora chasers, the Ovation model map shows the predicted auroral oval extent and intensity. Keep in mind that the Kp-index threshold for visible aurora at mid-latitudes is typically around Kp 5 or higher. The 27-day outlook helps you plan aurora photography trips weeks in advance, though it should be treated as guidance rather than certainty.
The alert feed shows every watch, warning, and advisory currently in effect. If you see a G2 or higher warning, expect increased geomagnetic activity within hours. Solar wind data from DSCOVR at L1 is also available in real-time, letting you check conditions yourself before relying on any forecast.
FAQs
How is space weather predicted?
Space weather is predicted by monitoring the Sun continuously using satellites like GOES, ACE, SOHO, and SDO, along with a global network of ground-based observatories. Forecasters analyze real-time data for solar flares, coronal mass ejections, and high-speed solar wind streams, then run numerical models like WSA-Enlil to predict when these events will reach Earth and what impact they may have.
How accurate are NOAA space weather forecasts?
CME arrival time forecasts are typically accurate within plus or minus 6 to 12 hours thanks to the WSA-Enlil model. Intensity forecasts are less reliable because the magnetic orientation of an arriving CME, the key driver of storm strength, cannot be reliably predicted until the CME reaches the L1 satellite roughly 30 to 60 minutes before impact. This is why NOAA forecasts tend to be more conservative than media or enthusiast reports.
What is the hardest space weather event to predict?
The intensity of a geomagnetic storm is the hardest element to predict. Even when forecasters know a CME is Earth-directed and can estimate its arrival time accurately, the storm strength depends on the southward orientation of the interplanetary magnetic field (negative Bz) at impact, which current models cannot forecast until the CME arrives at the L1 monitoring point near Earth.
What is the difference between a space weather watch, warning, and advisory?
A watch means conditions are favorable for a space weather event in the coming days. A warning means a significant event is occurring or imminent and protective action should be taken. An advisory indicates a minor event is in progress but is not expected to cause significant impact. This three-tier system mirrors the National Weather Service alert structure used for terrestrial weather.
What is the 27-day space weather forecast from NOAA?
The 27-day forecast leverages the fact that the Sun rotates on its axis approximately every 27 days as seen from Earth. Active regions and coronal holes that face Earth today will return to face Earth again about 27 days later. NOAA uses this recurrence pattern, called persistence forecasting, to predict when known solar features may cause geomagnetic activity during the next solar rotation.
What satellites do NOAA forecasters use to predict space weather?
NOAA forecasters primarily use GOES satellites for X-ray flare detection, DSCOVR and ACE at the L1 Lagrange point for real-time solar wind monitoring, SOHO for coronagraph CME imagery, and SDO for detailed solar surface imaging. Ground-based observatories including USAF-sponsored optical sites and the Mauna Loa K-Coronagraph supplement satellite data.
Conclusion
Understanding how forecasters at NOAA predict space weather day to day reveals a remarkable system built on decades of operational experience, a global network of monitoring instruments, and the irreplaceable judgment of trained scientists. From the moment a solar flare erupts to the instant a geomagnetic storm warning reaches a power grid operator, the SWPC pipeline of observation, analysis, modeling, and communication runs without interruption.
The process is not perfect. CME arrival times carry hours of uncertainty, storm intensity remains difficult to predict in advance, and the Sun routinely surprises even the most experienced forecasters. Yet this small team in Boulder provides a critical service that protects billions of dollars in infrastructure and countless lives that depend on satellites, power grids, and communication systems.
If you want to follow their work, visit the SWPC website, read the daily forecast discussion, and watch the 3-day Kp forecast. The next time you see an aurora glowing at your latitude, you will know exactly how NOAA forecasters predicted space weather that day to day, and you will appreciate the science behind that prediction.